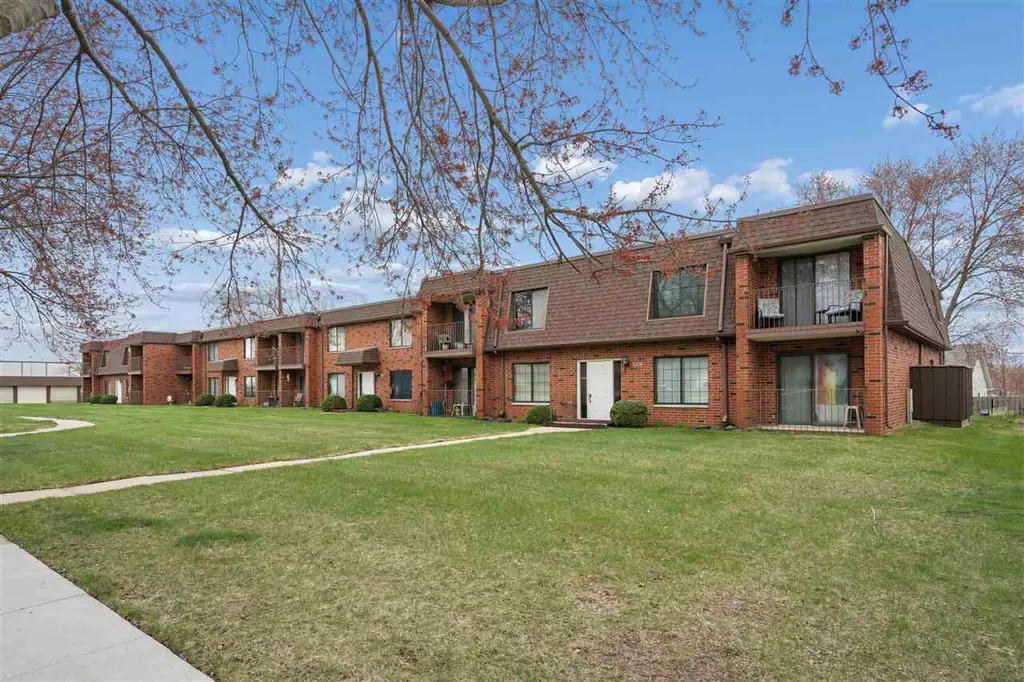
5703 Golden Ct NE #42 Ct
Cedar Rapids, IA 52402
$119,950D
2 bd · 2.0 ba ·
1,136 sqft ·
Built 1975
· Other
· Pending
· 5 DOM
Cashflow @ list (25.0% down · 7.5%)
Estimated rent
$1,215/mo
Mortgage (P&I)
−$629
Tax + insurance
−$222
HOA
−$240
Vac / Maint / Mgmt
−$255
Net cashflow
$-131/mo
Annual
$-1,577/yr
Cap rate
4.98%
Cash-on-cash
-4.69%
DSCR
0.79
1% rule
1.01%
Cash to close
$33,586
Investor read
- This is a 2-bed/2.0-bath other listed at $120k.
- At list price, monthly cash flow is $-131 ($-2k/yr) — negative.
- To cash-flow at today's rent, offer at most $97k (19.4% below list).
- Meets the 1% rule at list price ($1k rent vs $120k).
- Only 5 days on market — expect competitive offers; lowballing is unlikely to land.
- Recommended offer: $97k (19.4% below list) — sets the bar for cash-flow.
- Local home prices are declining (-3.0%/yr); year-one equity from $830 of loan paydown is wiped out by about $4k of value loss. Plan a longer hold.
- Location reads 78/100 on livability (#134 in IA, #2,474 nationally) — a middle-class / working-renter tenant base. Strengths: cost of living A+, housing A+, health & safety A+; Watch: crime C-, commute F.
- Linn-Mar Community School District (suburban): math 75% / reading 76% proficiency, ranked #44 of 289 in IA (top 15%) — strong family-tenant draw, lease renewals of 3-5y typical; only 16% free/reduced lunch — higher-income household profile.
- Zoned schools: Westfield Elementary School (math 87% / reading 77%, grade A+, #44 of 616 statewide, top 9%, 506 students, 20% FRL) — zoned schools at 20% FRL track the district average.
- Market conditions: Rents rising fast (+11.0%/yr); 286 active listings in the ZIP; 6 comparable units currently listed for rent nearby; rentals lingering (median 44d on market — plan ~5-8 weeks vacancy on turnover, expect pricing pressure); 50% of comp listings sitting > 30 days — soft ceiling on asking rent; 1,023 units permitted in Linn County in 2024 (456 in 5+ unit buildings).
- Linn County population projected at +16% by 2050 — long-run rental-demand tailwind backs the buy-and-hold thesis.
- 4 sale attempts since 5y ago with the ask held roughly flat each time — persistent listings suggest the price (not the market) is what's stuck; bring a comps-based counter.
- Cap rate 5.0% vs local median 3.5% in Cedar Rapids — top-decile yield for the area; either an underpriced asset or a hidden risk that comps aren't pricing in. Stress-test before assuming the spread holds.
Questions for listing agent
- What do current leases actually rent for vs. the listed asking? Can we see a recent rent roll and the last 12 months of T-12 income?
- Built in 1975 — when were the roof, HVAC, electrical panel, plumbing, and water heater last replaced?
- What does the HOA fee cover, when was the last increase, and are there any pending special assessments or reserve-fund shortfalls?
- Is there a deadline driving the sale (1031 exchange, divorce, estate, relocation)? That informs how much negotiation room exists.
- Schools are B-rated — typically a magnet for longer-tenancy family renters. What's the average tenant stay here, and is there a school-zone premium baked into asking?
- The area grade is low — what's the realistic commute time and amenity access for the typical tenant pool here? Any planned neighborhood developments (good or bad) we should know about?
- What's the average days-on-market for RENTAL listings here right now (not sales)? A rising rental-DOM trend means longer vacancies and softer asking-rent achievability than the comps imply.
- What's the recent tenant-quality profile in this submarket — average credit score on applications, eviction rate, late-payment / NSF rate, and stable-employment percentage? A property-management company in the area should have these aggregated.
CashFlowRE · CFR-S2SK9E7VGD0EYF
· Data 6 days ago
cashflowre.app · 2026-05-29