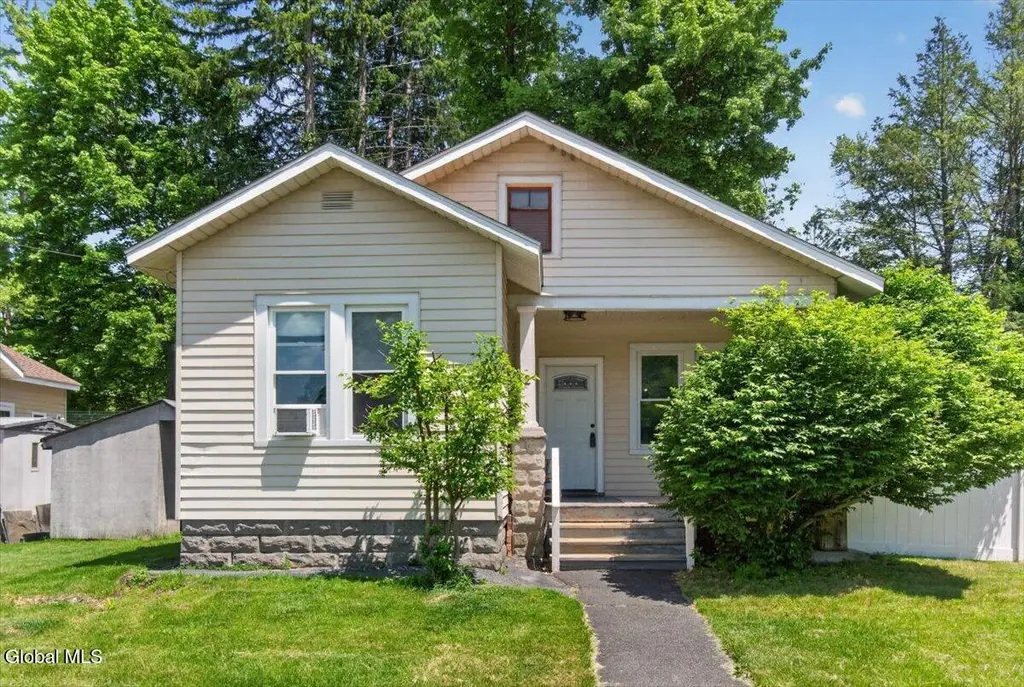
2 Woodlawn Ter
Albany, NY 12054
$299,900C-
4 bd · 1.5 ba ·
1,050 sqft ·
Built 1910
· SingleFamily
· Pending
· 20 DOM
Cashflow @ list (25.0% down · 7.5%)
Estimated rent
$2,692/mo
Mortgage (P&I)
−$1,573
Tax + insurance
−$588
HOA
−$0
Vac / Maint / Mgmt
−$565
Net cashflow
$-34/mo
Annual
$-408/yr
Cap rate
6.16%
Cash-on-cash
-0.49%
DSCR
0.98
1% rule
0.90%
Cash to close
$83,972
Investor read
- This is a 4-bed/1.5-bath single-family listed at $300k.
- At list price, monthly cash flow is $-34 ($-408/yr) — negative.
- To cash-flow at today's rent, offer at most $294k (2.0% below list).
- To meet the 1% rule (rent ≥ 1% of price), the offer needs to be $269k (10.2% below list).
- It's been on market 20 days — a 2% lower offer ($295k) is reasonable based on typical stale-listing flexibility.
- Recommended offer: $269k (10.2% below list) — sets the bar for 1% rule.
- Local home prices are declining (-3.0%/yr); year-one equity from $2k of loan paydown is wiped out by about $9k of value loss. Plan a longer hold.
- Location reads 79/100 on livability (#129 in NY, #2,083 nationally) — a middle-class / working-renter tenant base. Strengths: amenities A+, commute A+, housing A+; Watch: employment C-, crime F.
- Bethlehem Central School District (suburban): math 70% / reading 74% proficiency, ranked #90 of 590 in NY (top 15%) — strong family-tenant draw, lease renewals of 3-5y typical; only 7% free/reduced lunch — higher-income household profile.
- Zoned schools: Slingerlands Elementary School (math 67% / reading 77%, grade A-, #378 of 2,108 statewide, top 20%, 462 students, 10% FRL); Bethlehem Central Middle School (math 50% / reading 69%, grade B, #161 of 729 statewide, top 24%, 923 students, 14% FRL); Bethlehem Central Senior High School (math 100% / reading 87%, grade A+, #141 of 1,100 statewide, top 13%, 1,364 students, 13% FRL).
- Watch-outs: built in 1910 — expect roof / HVAC / electrical / plumbing capex.
- Market conditions: 70 active listings in the ZIP; high-income renter base; 675 units permitted in Albany County in 2024 (451 in 5+ unit buildings).
- Albany County population projected at +9% by 2050 — modest demand growth; plan on rents tracking national, not racing it.
- 4 sale attempts since 12y ago with the ask held roughly flat each time — persistent listings suggest the price (not the market) is what's stuck; bring a comps-based counter.
- Current owner paid $160k; list at $300k implies a 88% gain — meaningful room to come down on a strong offer.
Questions for listing agent
- What do current leases actually rent for vs. the listed asking? Can we see a recent rent roll and the last 12 months of T-12 income?
- Built in 1910 — when were the roof, HVAC, electrical panel, plumbing, and water heater last replaced?
- Is there a deadline driving the sale (1031 exchange, divorce, estate, relocation)? That informs how much negotiation room exists.
- Crime grade is F in this area — have there been break-ins, vandalism, or insurance claims at this property in the last 3 years? What carrier currently insures it and at what premium?
- What's the average days-on-market for RENTAL listings here right now (not sales)? A rising rental-DOM trend means longer vacancies and softer asking-rent achievability than the comps imply.
- What's the recent tenant-quality profile in this submarket — average credit score on applications, eviction rate, late-payment / NSF rate, and stable-employment percentage? A property-management company in the area should have these aggregated.
- How much new for-sale + rental construction is in the pipeline within 1–3 miles? Heavy new supply typically softens prices + rents 12–24 months out; constrained supply supports both.
CashFlowRE · CFR-S31V0GD92DDF9Q
· Data 3 days ago
cashflowre.app · 2026-05-29