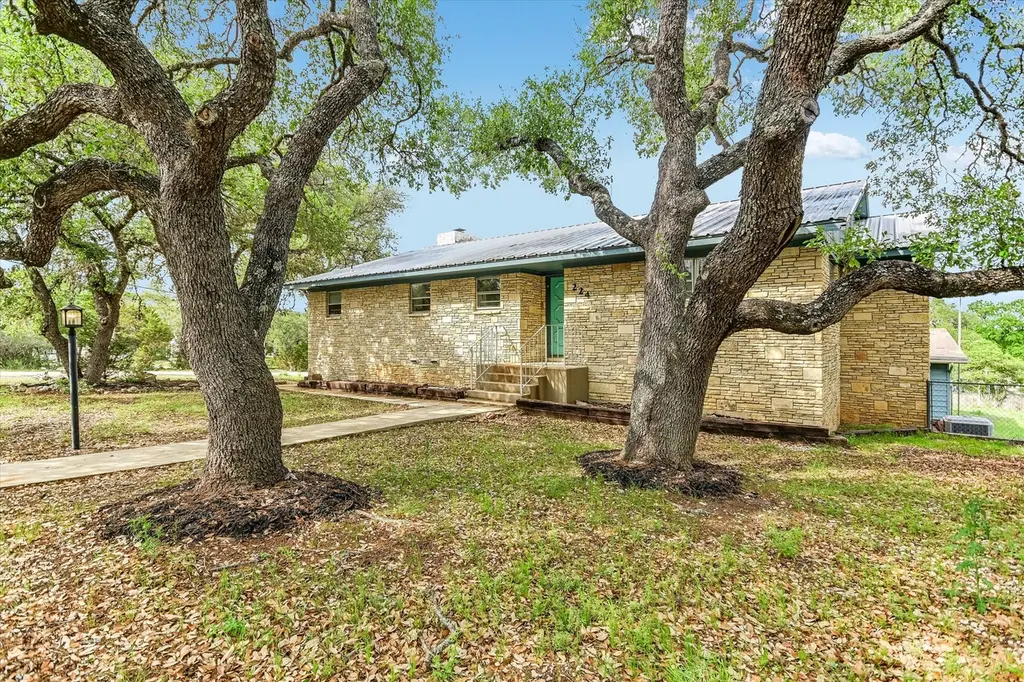
224 Circle Hvn
Canyon Lake, TX 78133
$397,000D
3 bd · 3.0 ba ·
2,518 sqft ·
Built 1971
· SingleFamily
· Active
· 63 DOM
Cashflow @ list (25.0% down · 7.5%)
Estimated rent
$2,913/mo
Mortgage (P&I)
−$2,082
Tax + insurance
−$626
HOA
−$29
Vac / Maint / Mgmt
−$612
Net cashflow
$-435/mo
Annual
$-5,220/yr
Cap rate
4.98%
Cash-on-cash
-4.70%
DSCR
0.79
1% rule
0.73%
Cash to close
$111,160
Investor read
- This is a 3-bed/3.0-bath single-family listed at $397k.
- At list price, monthly cash flow is $-435 ($-5k/yr) — negative.
- To cash-flow at today's rent, offer at most $320k (19.4% below list).
- To meet the 1% rule (rent ≥ 1% of price), the offer needs to be $291k (26.6% below list).
- It's been on market 63 days — a 6% lower offer ($373k) is reasonable based on typical stale-listing flexibility.
- Recommended offer: $291k (26.6% below list) — sets the bar for 1% rule.
- Local home prices are declining (-3.0%/yr); year-one equity from $3k of loan paydown is wiped out by about $12k of value loss. Plan a longer hold.
- Location reads 67/100 on livability (#534 in TX) — a middle-class / working-renter tenant base. Strengths: employment A+, housing A+, cost of living A; Watch: schools C-, amenities F, commute F.
- Comal ISD (rural): math 57% / reading 59% proficiency, ranked #58 of 826 in TX (top 7%) — acceptable for families but not a draw, mixed tenant base, ~2y average lease.
- Market conditions: Rents soft (-1.2%/yr); 1014 active listings in the ZIP; 5 comparable units currently listed for rent nearby; rentals at typical pace (median 19d on market — plan ~3-4 weeks tenant-placement turnaround); 40% of comp listings sitting > 30 days — soft ceiling on asking rent; solid renter incomes; 3,420 units permitted in Comal County in 2024 (1,164 in 5+ unit buildings).
- Comal County population projected at +70% by 2050 — long-run rental-demand tailwind backs the buy-and-hold thesis.
- 4 sale attempts since 13y ago; this cycle's ask has dropped $30k (7%) from the opening price — seller is motivated, your offer sets the floor, not the list.
- Current owner paid $200k; list at $397k implies a 98% gain — meaningful room to come down on a strong offer.
- Climate carrying-cost: severe wind risk, 80% chance of damaging wind over 30y; extreme-heat days projected 7→22/yr by 2055 (HVAC capex compounding) — expect insurance premiums to compound above CPI over the hold.
- Cap rate 5.0% vs local median 2.3% in Canyon Lake — top-decile yield for the area; either an underpriced asset or a hidden risk that comps aren't pricing in. Stress-test before assuming the spread holds.
- This rent runs 42% of the median local income ($84k/yr) — at the standard rent-burdened threshold; future hikes will face affordability resistance.
Questions for listing agent
- What do current leases actually rent for vs. the listed asking? Can we see a recent rent roll and the last 12 months of T-12 income?
- It's been on market 63 days. Have you received any prior offers? Is the seller open to a 27% concession, seller financing, or rate buy-down credit?
- Built in 1971 — when were the roof, HVAC, electrical panel, plumbing, and water heater last replaced?
- What does the HOA fee cover, when was the last increase, and are there any pending special assessments or reserve-fund shortfalls?
- Why hasn't it sold? Are there any deal-killer items the seller is aware of (foundation, flood, title, zoning, code violations)?
- Is there a deadline driving the sale (1031 exchange, divorce, estate, relocation)? That informs how much negotiation room exists.
- The area grade is low — what's the realistic commute time and amenity access for the typical tenant pool here? Any planned neighborhood developments (good or bad) we should know about?
- What's the average days-on-market for RENTAL listings here right now (not sales)? A rising rental-DOM trend means longer vacancies and softer asking-rent achievability than the comps imply.
CashFlowRE · CFR-S32NHCFAFK2RWV
· Data 2 days ago
cashflowre.app · 2026-05-29