8604 W Pin Oak Dr
Ingalls, IN 46064
$89,000B-
3 bd · 2.0 ba ·
1,280 sqft ·
Built 2022
· Other
· Active
· 15 DOM
Cashflow @ list (25.0% down · 7.5%)
Estimated rent
$1,784/mo
Mortgage (P&I)
−$467
Tax + insurance
−$148
HOA
−$0
Vac / Maint / Mgmt
−$375
Net cashflow
$794/mo
Annual
$9,529/yr
Cap rate
17.00%
Cash-on-cash
38.24%
DSCR
2.70
1% rule
2.00%
Cash to close
$24,920
Investor read
- This is a 3-bed/2.0-bath other listed at $89k. Condition is rated fair.
- At list price, monthly cash flow is $794 ($10k/yr) — positive.
- The deal already cash-flows at list — no discount required.
- Meets the 1% rule at list price ($2k rent vs $89k).
- It's been on market 15 days — a 2% lower offer ($88k) is reasonable based on typical stale-listing flexibility.
- Recommended offer: $88k (1.5% below list) — sets the bar for market timing.
- Local home prices are declining (-3.0%/yr); year-one equity from $615 of loan paydown is wiped out by about $3k of value loss. Plan a longer hold.
- Location reads 64/100 on livability (#391 in IN) — a middle-class / working-renter tenant base. Strengths: crime A+, cost of living A+, housing A+; Watch: employment C-, amenities F, commute F.
- South Madison Community School Corporation (rural): math 44% / reading 52% proficiency, ranked #60 of 301 in IN (top 20%) — families likely to look elsewhere, expect single-tenant / working-renter base with shorter leases.
- Zoned schools: Pendleton Elementary School (math 54% / reading 49%, grade C-, #256 of 994 statewide, top 26%, 840 students, 36% FRL); Pendleton Heights Middle School (math 37% / reading 48%, grade D-, #98 of 330 statewide, top 30%, 721 students, 36% FRL); Pendleton Heights High School (math 36% / reading 77%, grade C, #70 of 369 statewide, top 19%, 1,357 students, 31% FRL).
- Market conditions: 237 active listings in the ZIP; 2 comparable units currently listed for rent nearby; 184 units permitted in Madison County in 2024 (0 in 5+ unit buildings).
- Madison County population projected at -14% by 2050 — secular population decline; favor cash flow + early exit over multi-decade hold.
- At projected returns (-3.0% appreciation + 3.0% rent growth), your $25k cash investment doubles in ~4 years — after that, you're playing with house money.
- Cap rate 17.0% vs local median 4.0% in Ingalls — top-decile yield for the area; either an underpriced asset or a hidden risk that comps aren't pricing in. Stress-test before assuming the spread holds.
Questions for listing agent
- Have any recent inspections been done? Can we get a copy of the seller's disclosures and any deferred-maintenance estimates?
- Is there a deadline driving the sale (1031 exchange, divorce, estate, relocation)? That informs how much negotiation room exists.
- Schools are F-rated, which usually means shorter tenancies and higher turnover. Who's the typical renter profile here, and what's been the actual vacancy rate?
- What's the average days-on-market for RENTAL listings here right now (not sales)? A rising rental-DOM trend means longer vacancies and softer asking-rent achievability than the comps imply.
- What's the recent tenant-quality profile in this submarket — average credit score on applications, eviction rate, late-payment / NSF rate, and stable-employment percentage? A property-management company in the area should have these aggregated.
- How much new for-sale + rental construction is in the pipeline within 1–3 miles? Heavy new supply typically softens prices + rents 12–24 months out; constrained supply supports both.
Repairs flagged (vision-AI assessment)
- Major: roof — The satellite image shows visible discoloration and potential wear on the roof.
- Major: exterior siding — The satellite image shows visible wear and tear on the siding, indicating potential damage or the need for repainting/staining.
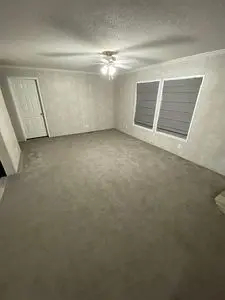
- Minor: interior carpeting — The carpeting appears to have some wear, but is not in critical condition and could be cleaned or replaced with a more modern material.
CashFlowRE · CFR-S55FJWAF9GD018
· Data 1 day ago
cashflowre.app · 2026-05-29