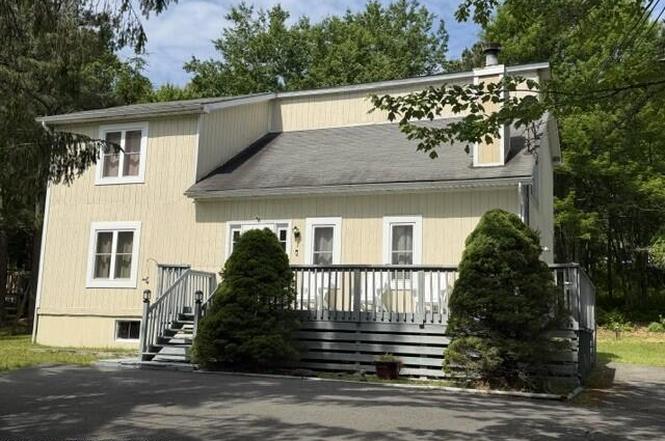
181 Granite Rd
Emerald Lakes, PA 18334
$410,000F
4 bd · 3.0 ba ·
1,982 sqft ·
Built 1989
· SingleFamily
· Active
· 4 DOM
Cashflow @ list (25.0% down · 7.5%)
Estimated rent
$3,075/mo
Mortgage (P&I)
−$2,150
Tax + insurance
−$471
HOA
−$107
Vac / Maint / Mgmt
−$646
Net cashflow
$-299/mo
Annual
$-3,584/yr
Cap rate
5.42%
Cash-on-cash
-3.12%
DSCR
0.86
1% rule
0.75%
Cash to close
$114,800
Investor read
- This is a 4-bed/3.0-bath single-family listed at $410k.
- At list price, monthly cash flow is $-299 ($-4k/yr) — negative.
- To cash-flow at today's rent, offer at most $357k (12.9% below list).
- To meet the 1% rule (rent ≥ 1% of price), the offer needs to be $308k (25.0% below list).
- Only 4 days on market — expect competitive offers; lowballing is unlikely to land.
- Recommended offer: $308k (25.0% below list) — sets the bar for 1% rule.
- Local home prices are declining (-0.9%/yr); year-one equity from $3k of loan paydown is wiped out by about $4k of value loss. Plan a longer hold.
- Location reads 67/100 on livability (#974 in PA) — a middle-class / working-renter tenant base. Strengths: crime A+, cost of living A+, housing A+; Watch: health & safety D, schools D-, amenities F.
- Pocono Mountain SD (rural): math 37% / reading 55% proficiency, ranked #245 of 539 in PA (top 46%) — families likely to look elsewhere, expect single-tenant / working-renter base with shorter leases.
- Market conditions: 107 active listings in the ZIP; 3 comparable units currently listed for rent nearby; rentals lingering (median 44d on market — plan ~5-8 weeks vacancy on turnover, expect pricing pressure); 100% of comp listings sitting > 30 days — soft ceiling on asking rent; 278 units permitted in Monroe County in 2024 (52 in 5+ unit buildings).
- Monroe County population projected at -11% by 2050 — secular population decline; favor cash flow + early exit over multi-decade hold.
- 8 sale attempts since 12y ago with the ask held roughly flat each time — persistent listings suggest the price (not the market) is what's stuck; bring a comps-based counter.
- Current owner paid $135k; list at $410k implies a 204% gain — meaningful room to come down on a strong offer.
- Cap rate 5.4% vs local median 4.0% in Emerald Lakes — top-decile yield for the area; either an underpriced asset or a hidden risk that comps aren't pricing in. Stress-test before assuming the spread holds.
Questions for listing agent
- What do current leases actually rent for vs. the listed asking? Can we see a recent rent roll and the last 12 months of T-12 income?
- What does the HOA fee cover, when was the last increase, and are there any pending special assessments or reserve-fund shortfalls?
- Is there a deadline driving the sale (1031 exchange, divorce, estate, relocation)? That informs how much negotiation room exists.
- Schools are D-rated, which usually means shorter tenancies and higher turnover. Who's the typical renter profile here, and what's been the actual vacancy rate?
- The area grade is low — what's the realistic commute time and amenity access for the typical tenant pool here? Any planned neighborhood developments (good or bad) we should know about?
- What's the average days-on-market for RENTAL listings here right now (not sales)? A rising rental-DOM trend means longer vacancies and softer asking-rent achievability than the comps imply.
- What's the recent tenant-quality profile in this submarket — average credit score on applications, eviction rate, late-payment / NSF rate, and stable-employment percentage? A property-management company in the area should have these aggregated.
- How much new for-sale + rental construction is in the pipeline within 1–3 miles? Heavy new supply typically softens prices + rents 12–24 months out; constrained supply supports both.
CashFlowRE · CFR-S5KBKY73Z445WS
· Data 1 day ago
cashflowre.app · 2026-05-29