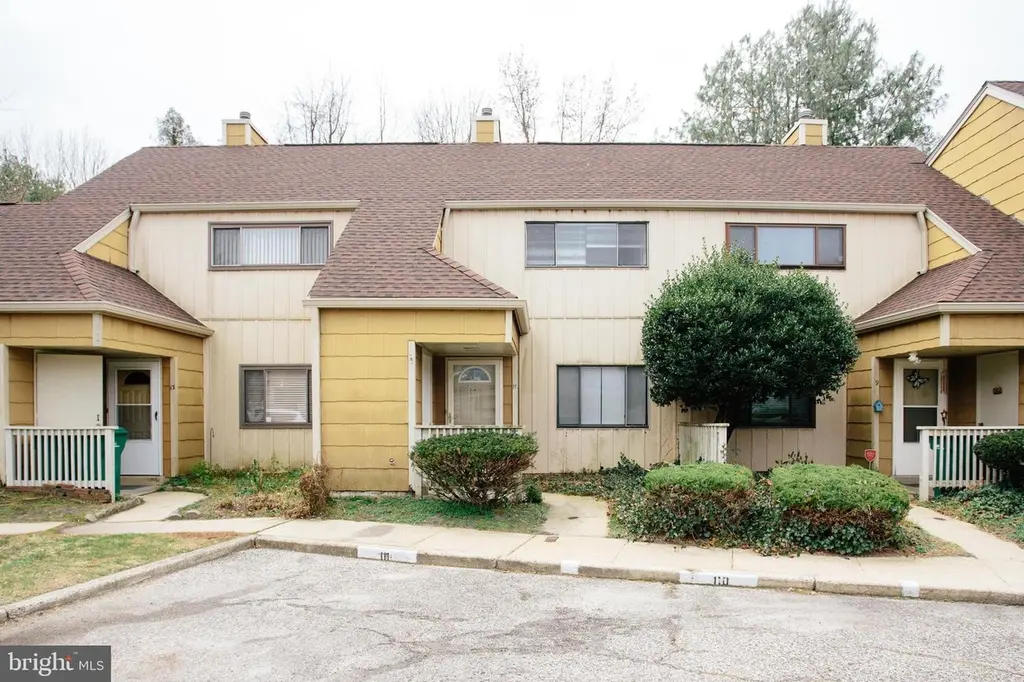
11 Dover Dr
Lindenwold, NJ 08021
$125,000B-
2 bd · 1.5 ba ·
1,267 sqft ·
Built 1973
· Townhouse
· Pending
· 14 DOM
Cashflow @ list (25.0% down · 7.5%)
Estimated rent
$2,258/mo
Mortgage (P&I)
−$656
Tax + insurance
−$208
HOA
−$654
Vac / Maint / Mgmt
−$474
Net cashflow
$266/mo
Annual
$3,189/yr
Cap rate
8.84%
Cash-on-cash
9.11%
DSCR
1.41
1% rule
1.81%
Cash to close
$35,000
Investor read
- This is a 2-bed/1.5-bath townhouse listed at $125k. Condition is rated fair.
- At list price, monthly cash flow is $266 ($3k/yr) — positive.
- The deal already cash-flows at list — no discount required.
- Meets the 1% rule at list price ($2k rent vs $125k).
- Only 14 days on market — expect competitive offers; lowballing is unlikely to land.
- Local home prices are declining (-3.0%/yr); year-one equity from $864 of loan paydown is wiped out by about $4k of value loss. Plan a longer hold.
- Location reads 68/100 on livability (#312 in NJ) — a middle-class / working-renter tenant base. Strengths: housing A+, health & safety A, cost of living B; Watch: employment C-, crime D, schools F.
- Lindenwold Public School District (suburban): math 4% / reading 25% proficiency, ranked #461 of 472 in NJ (top 98%) — low school quality limits family demand, transient renter base, plan for 1-2y turnover; 68% free/reduced lunch — lower-income household profile, screen leases tightly.
- Watch-outs: HOA is 29% of rent.
- Market conditions: Rents rising (+3.0%/yr); 237 active listings in the ZIP; 16 comparable units currently listed for rent nearby; rentals leasing fast (median 3d on market — plan ~1-2 weeks tenant-placement turnaround); 1,018 units permitted in Camden County in 2024 (509 in 5+ unit buildings).
- Camden County population projected to shrink 8% by 2050 — rents likely to lag national; underwrite the cash flow, not the appreciation.
- 4 sale attempts since 5y ago with the ask held roughly flat each time — persistent listings suggest the price (not the market) is what's stuck; bring a comps-based counter.
- Current owner paid $82k; list at $125k implies a 52% gain — meaningful room to come down on a strong offer.
- Cap rate 8.8% vs local median 5.3% in Lindenwold — top-decile yield for the area; either an underpriced asset or a hidden risk that comps aren't pricing in. Stress-test before assuming the spread holds.
- This rent runs 40% of the median local income ($68k/yr) — at the standard rent-burdened threshold; future hikes will face affordability resistance.
Questions for listing agent
- Have any recent inspections been done? Can we get a copy of the seller's disclosures and any deferred-maintenance estimates?
- Built in 1973 — when were the roof, HVAC, electrical panel, plumbing, and water heater last replaced?
- What does the HOA fee cover, when was the last increase, and are there any pending special assessments or reserve-fund shortfalls?
- Is there a deadline driving the sale (1031 exchange, divorce, estate, relocation)? That informs how much negotiation room exists.
- Schools are F-rated, which usually means shorter tenancies and higher turnover. Who's the typical renter profile here, and what's been the actual vacancy rate?
- Crime grade is D in this area — have there been break-ins, vandalism, or insurance claims at this property in the last 3 years? What carrier currently insures it and at what premium?
- What's the average days-on-market for RENTAL listings here right now (not sales)? A rising rental-DOM trend means longer vacancies and softer asking-rent achievability than the comps imply.
- What's the recent tenant-quality profile in this submarket — average credit score on applications, eviction rate, late-payment / NSF rate, and stable-employment percentage? A property-management company in the area should have these aggregated.
Repairs flagged (vision-AI assessment)
- Major: kitchen cabinets — Old and outdated
- Major: bathroom fixtures — Old and outdated
- Moderate: exterior siding — Weathered and in need of repainting
- Major: landscaping — Overgrown and unkempt
CashFlowRE · CFR-S6BSD5DBBZX5V8
· Data 1 week ago
cashflowre.app · 2026-05-29