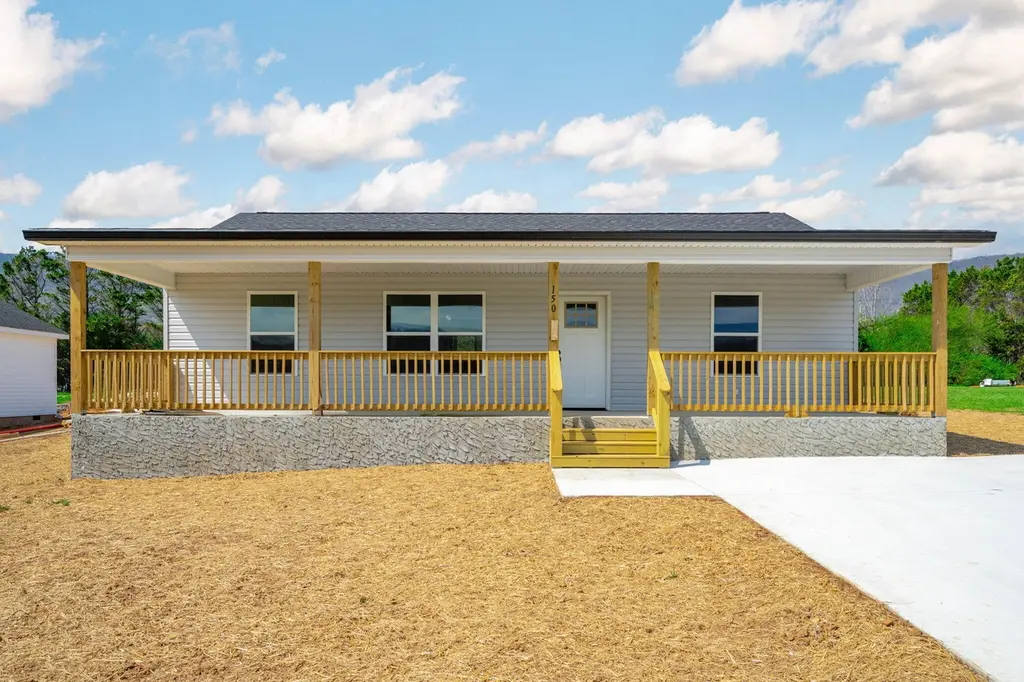
150 Galloway Airport Rd
Dunlap, TN 37327
$249,900D
3 bd · 2.0 ba ·
1,200 sqft ·
Built 2026
· SingleFamily
· Pending
· 44 DOM
Cashflow @ list (25.0% down · 7.5%)
Estimated rent
$1,445/mo
Mortgage (P&I)
−$1,311
Tax + insurance
−$542
HOA
−$0
Vac / Maint / Mgmt
−$304
Net cashflow
$-710/mo
Annual
$-8,525/yr
Cap rate
3.48%
Cash-on-cash
-10.04%
DSCR
0.55
1% rule
0.58%
Cash to close
$69,972
Investor read
- This is a 3-bed/2.0-bath single-family listed at $250k.
- At list price, monthly cash flow is $-710 ($-9k/yr) — negative.
- To cash-flow at today's rent, offer at most $147k (41.1% below list).
- To meet the 1% rule (rent ≥ 1% of price), the offer needs to be $145k (42.2% below list).
- It's been on market 44 days — a 3% lower offer ($242k) is reasonable based on typical stale-listing flexibility.
- Recommended offer: $145k (42.2% below list) — sets the bar for 1% rule.
- In year one you build about $27k of equity ($2k loan paydown + $25k appreciation (10.0% local appreciation)).
- Location reads 60/100 on livability (#264 in TN) — a middle-class / working-renter tenant base. Strengths: cost of living A+, crime A-, housing B; Watch: schools F, amenities F, commute F.
- Sequatchie County (rural): math 24% / reading 24% proficiency, ranked #95 of 139 in TN (top 68%) — low school quality limits family demand, transient renter base, plan for 1-2y turnover.
- Watch-outs: flood insurance adds $125/mo.
- Market conditions: 317 active listings in the ZIP; 3 comparable units currently listed for rent nearby; rentals at typical pace (median 14d on market — plan ~3-4 weeks tenant-placement turnaround); 37 units permitted in Sequatchie County in 2024 (0 in 5+ unit buildings).
- Sequatchie County population projected at +8% by 2050 — modest demand growth; plan on rents tracking national, not racing it.
- By year 2, paydown + projected appreciation supports a ~$43k cash-out refi (75% LTV) — recoverable capital for the next deal without selling this one.
- Climate carrying-cost: in FEMA flood zone A (mandatory federal flood insurance); moderate wildfire risk; extreme-heat days projected 8→22/yr by 2055 (HVAC capex compounding) — expect insurance premiums to compound above CPI over the hold.
- Cap rate 3.5% vs local median 2.4% in Dunlap — top-decile yield for the area; either an underpriced asset or a hidden risk that comps aren't pricing in. Stress-test before assuming the spread holds.
Questions for listing agent
- What do current leases actually rent for vs. the listed asking? Can we see a recent rent roll and the last 12 months of T-12 income?
- It's been on market 44 days. Have you received any prior offers? Is the seller open to a 42% concession, seller financing, or rate buy-down credit?
- What's the actual annual flood-insurance premium (NFIP or private), and is the property in a SFHA with mandatory coverage?
- Is there a deadline driving the sale (1031 exchange, divorce, estate, relocation)? That informs how much negotiation room exists.
- Schools are F-rated, which usually means shorter tenancies and higher turnover. Who's the typical renter profile here, and what's been the actual vacancy rate?
- The area grade is low — what's the realistic commute time and amenity access for the typical tenant pool here? Any planned neighborhood developments (good or bad) we should know about?
- What's the average days-on-market for RENTAL listings here right now (not sales)? A rising rental-DOM trend means longer vacancies and softer asking-rent achievability than the comps imply.
- What's the recent tenant-quality profile in this submarket — average credit score on applications, eviction rate, late-payment / NSF rate, and stable-employment percentage? A property-management company in the area should have these aggregated.
CashFlowRE · CFR-S82NDD4P1VCJ9V
· Data 3 weeks ago
cashflowre.app · 2026-05-29