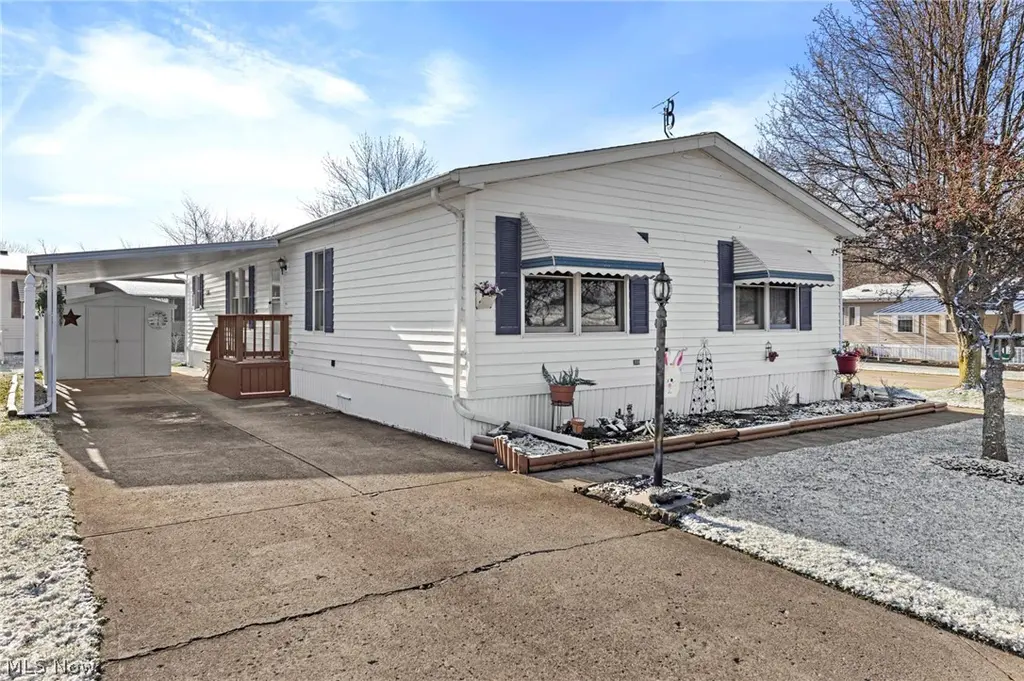
22 Lees Ln
Olmsted Falls, OH 44138
$94,900C-
2 bd · 2.0 ba ·
1,440 sqft ·
Built 1990
· SingleFamily
· Pending
· 33 DOM
Cashflow @ list (25.0% down · 7.5%)
Estimated rent
$1,861/mo
Mortgage (P&I)
−$498
Tax + insurance
−$225
HOA
−$699
Vac / Maint / Mgmt
−$391
Net cashflow
$49/mo
Annual
$585/yr
Cap rate
7.75%
Cash-on-cash
5.20%
DSCR
1.23
1% rule
1.96%
Cash to close
$26,572
Investor read
- This is a 2-bed/2.0-bath single-family listed at $95k. Condition is rated fair.
- At list price, monthly cash flow is $49 ($585/yr) — positive.
- The deal already cash-flows at list — no discount required.
- Meets the 1% rule at list price ($2k rent vs $95k).
- It's been on market 33 days — a 3% lower offer ($92k) is reasonable based on typical stale-listing flexibility.
- Recommended offer: $92k (3.0% below list) — sets the bar for market timing.
- Local home prices are declining (-3.0%/yr); year-one equity from $656 of loan paydown is wiped out by about $3k of value loss. Plan a longer hold.
- Location reads 73/100 on livability (#343 in OH) — a middle-class / working-renter tenant base. Strengths: schools A+, crime A+, employment A+; Watch: amenities F, commute F, health & safety F.
- Olmsted Falls City (suburban): math 70% / reading 70% proficiency, ranked #134 of 656 in OH (top 20%) — strong family-tenant draw, lease renewals of 3-5y typical; only 13% free/reduced lunch — higher-income household profile.
- Watch-outs: flood insurance adds $66/mo; HOA is 38% of rent.
- Market conditions: 183 active listings in the ZIP; 2 comparable units currently listed for rent nearby; solid renter incomes; 1,441 units permitted in Cuyahoga County in 2024 (700 in 5+ unit buildings).
- Cuyahoga County population projected to shrink 8% by 2050 — rents likely to lag national; underwrite the cash flow, not the appreciation.
- 2 sale attempts since 3y ago with the ask held roughly flat each time — persistent listings suggest the price (not the market) is what's stuck; bring a comps-based counter.
- Current owner paid $65k; 46% above their basis — modest negotiation headroom, anchor on the comps not their cost.
- Climate carrying-cost: severe flood risk — expect insurance premiums to compound above CPI over the hold.
- Cap rate 7.7% vs local median 4.2% in Olmsted Falls — top-decile yield for the area; either an underpriced asset or a hidden risk that comps aren't pricing in. Stress-test before assuming the spread holds.
Questions for listing agent
- It's been on market 33 days. Have you received any prior offers? Is the seller open to a 3% concession, seller financing, or rate buy-down credit?
- Have any recent inspections been done? Can we get a copy of the seller's disclosures and any deferred-maintenance estimates?
- What's the actual annual flood-insurance premium (NFIP or private), and is the property in a SFHA with mandatory coverage?
- What does the HOA fee cover, when was the last increase, and are there any pending special assessments or reserve-fund shortfalls?
- Is there a deadline driving the sale (1031 exchange, divorce, estate, relocation)? That informs how much negotiation room exists.
- Schools are A-rated — typically a magnet for longer-tenancy family renters. What's the average tenant stay here, and is there a school-zone premium baked into asking?
- What's the average days-on-market for RENTAL listings here right now (not sales)? A rising rental-DOM trend means longer vacancies and softer asking-rent achievability than the comps imply.
- What's the recent tenant-quality profile in this submarket — average credit score on applications, eviction rate, late-payment / NSF rate, and stable-employment percentage? A property-management company in the area should have these aggregated.
Repairs flagged (vision-AI assessment)
- Minor: exterior siding — some discoloration
- Minor: interior paint — light wear
- Minor: landscaping — simple landscaping
CashFlowRE · CFR-SA504F9KM9FXNA
· Data 3 weeks ago
cashflowre.app · 2026-05-29