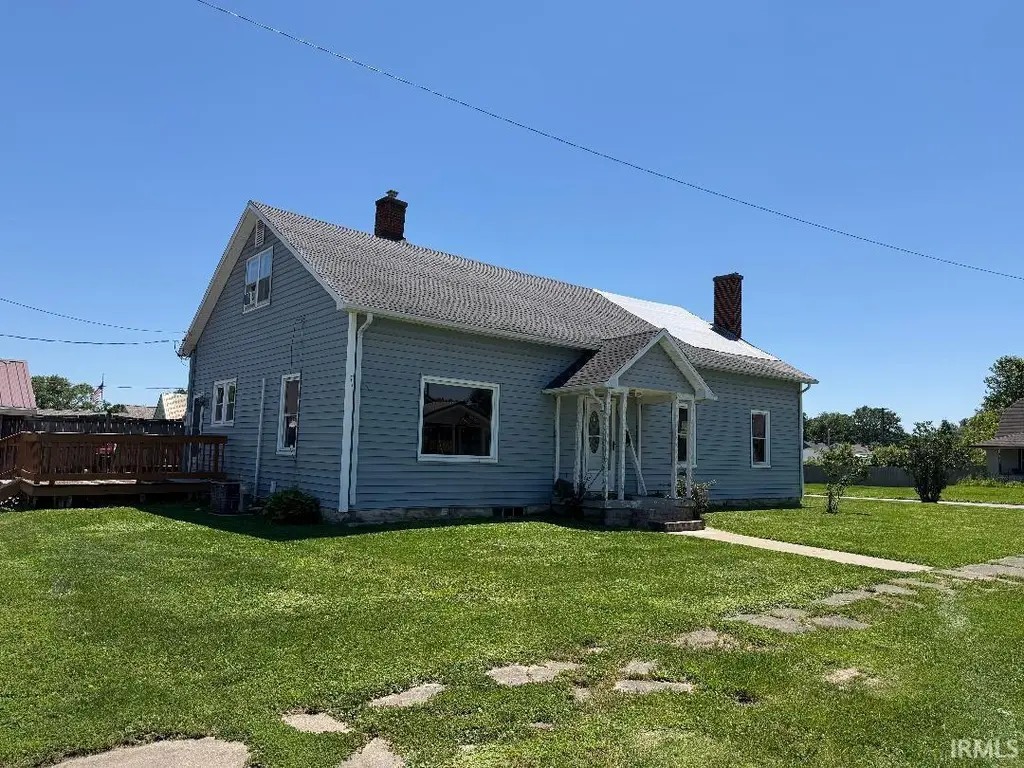
29 NE 6th St
Linton, IN 47441
$69,900B-
3 bd · 1.5 ba ·
2,940 sqft ·
Built 1860
· SingleFamily
· Active
· 16 DOM
Cashflow @ list (25.0% down · 7.5%)
Estimated rent
$1,377/mo
Mortgage (P&I)
−$367
Tax + insurance
−$173
HOA
−$0
Vac / Maint / Mgmt
−$289
Net cashflow
$548/mo
Annual
$6,576/yr
Cap rate
15.70%
Cash-on-cash
33.60%
DSCR
2.49
1% rule
1.97%
Cash to close
$19,572
Investor read
- This is a 3-bed/1.5-bath single-family listed at $70k.
- At list price, monthly cash flow is $548 ($7k/yr) — positive.
- The deal already cash-flows at list — no discount required.
- Meets the 1% rule at list price ($1k rent vs $70k).
- It's been on market 16 days — a 2% lower offer ($69k) is reasonable based on typical stale-listing flexibility.
- Recommended offer: $69k (1.5% below list) — sets the bar for market timing.
- Local home prices are declining (-3.0%/yr); year-one equity from $483 of loan paydown is wiped out by about $2k of value loss. Plan a longer hold.
- Location reads 71/100 on livability (#129 in IN) — a middle-class / working-renter tenant base. Strengths: cost of living A+, housing A+, health & safety A+; Watch: amenities F, commute F, employment F.
- Linton-Stockton School Corporation (town): math 39% / reading 45% proficiency, ranked #128 of 301 in IN (top 42%) — families likely to look elsewhere, expect single-tenant / working-renter base with shorter leases.
- Zoned schools: Linton-Stockton Elementary (math 55% / reading 47%, grade C-, #262 of 994 statewide, top 27%, 702 students, 53% FRL); Linton-Stockton Middle School (math 29% / reading 42%, grade F, #162 of 330 statewide, top 49%, 312 students, 52% FRL); Linton-Stockton High School (math 17% / reading 47%, grade F, #295 of 369 statewide, top 82%, 386 students, 48% FRL).
- Watch-outs: built in 1860 — expect roof / HVAC / electrical / plumbing capex.
- Market conditions: 66 active listings in the ZIP.
- Greene County population projected at -22% by 2050 — secular population decline; favor cash flow + early exit over multi-decade hold.
- 4 sale attempts since 9y ago with the ask held roughly flat each time — persistent listings suggest the price (not the market) is what's stuck; bring a comps-based counter.
- At projected returns (-3.0% appreciation + 3.0% rent growth), your $20k cash investment doubles in ~4 years — after that, you're playing with house money.
- Cap rate 15.7% vs local median 5.2% in Linton — top-decile yield for the area; either an underpriced asset or a hidden risk that comps aren't pricing in. Stress-test before assuming the spread holds.
Questions for listing agent
- Built in 1860 — when were the roof, HVAC, electrical panel, plumbing, and water heater last replaced?
- Is there a deadline driving the sale (1031 exchange, divorce, estate, relocation)? That informs how much negotiation room exists.
- Schools are D-rated, which usually means shorter tenancies and higher turnover. Who's the typical renter profile here, and what's been the actual vacancy rate?
- What's the average days-on-market for RENTAL listings here right now (not sales)? A rising rental-DOM trend means longer vacancies and softer asking-rent achievability than the comps imply.
- What's the recent tenant-quality profile in this submarket — average credit score on applications, eviction rate, late-payment / NSF rate, and stable-employment percentage? A property-management company in the area should have these aggregated.
- How much new for-sale + rental construction is in the pipeline within 1–3 miles? Heavy new supply typically softens prices + rents 12–24 months out; constrained supply supports both.
CashFlowRE · CFR-SAQ7Z9AFP3S3TR
· Data 2 days ago
cashflowre.app · 2026-05-29