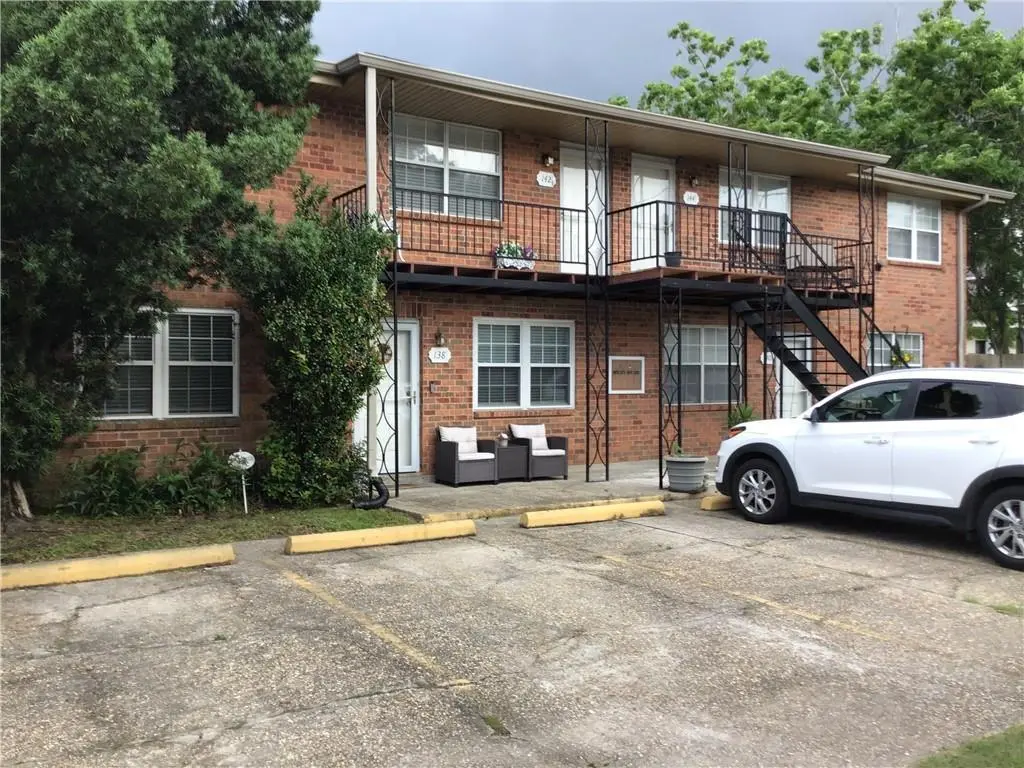
138-144 Normandy Ave
Harahan, LA 70123
$630,000C
8 bd · 4.0 ba ·
3,800 sqft ·
Built 1975
· MultiFamily
· Active
· 27 DOM
Cashflow @ list (25.0% down · 7.5%)
Estimated rent
$6,322/mo
Mortgage (P&I)
−$3,304
Tax + insurance
−$451
HOA
−$0
Vac / Maint / Mgmt
−$1,328
Net cashflow
$1,239/mo
Annual
$14,871/yr
Cap rate
8.65%
Cash-on-cash
8.43%
DSCR
1.38
1% rule
1.00%
Cash to close
$176,400
Investor read
- This is a 4 × 2-bed/1-bath units multifamily listed at $630k.
- At list price, monthly cash flow is $1k ($15k/yr) — positive. Per door: $310/mo.
- The deal already cash-flows at list — no discount required.
- Meets the 1% rule at list price ($6k rent vs $630k).
- It's been on market 27 days — a 2% lower offer ($621k) is reasonable based on typical stale-listing flexibility.
- Recommended offer: $621k (1.5% below list) — sets the bar for market timing.
- Local home prices are declining (-3.0%/yr); year-one equity from $4k of loan paydown is wiped out by about $19k of value loss. Plan a longer hold.
- Location reads 74/100 on livability (#27 in LA, #4,830 nationally) — a middle-class / working-renter tenant base. Strengths: schools A+, crime A+, housing A+; Watch: amenities F, commute F.
- Jefferson Parish (suburban): math 24% / reading 34% proficiency, ranked #44 of 98 in LA (top 45%) — low school quality limits family demand, transient renter base, plan for 1-2y turnover; 70% free/reduced lunch — lower-income household profile, screen leases tightly.
- Market conditions: Rents flat; 163 active listings in the ZIP; solid renter incomes; 518 units permitted in Jefferson Parish in 2024 (43 in 5+ unit buildings).
- 2 sale attempts with the ask held roughly flat each time — persistent listings suggest the price (not the market) is what's stuck; bring a comps-based counter.
- Current owner paid $105k; list at $630k implies a 500% gain — meaningful room to come down on a strong offer.
- Cap rate 8.7% vs local median 4.2% in Harahan — top-decile yield for the area; either an underpriced asset or a hidden risk that comps aren't pricing in. Stress-test before assuming the spread holds.
- At $6,322/mo this rent would consume 91% of the median local household income ($84k/yr) (locally 1282% of renters already pay >50% of income on rent) — very limited rent-growth headroom before tenants either downsize or default.
Questions for listing agent
- Can we see the unit-by-unit rent roll, current vacancy, and any below-market leases? What's the average tenancy length?
- What capital expenditures (roof, boiler, parking lot, exteriors) have been made in the last 5 years, and what's planned in the next 2?
- Built in 1975 — when were the roof, HVAC, electrical panel, plumbing, and water heater last replaced?
- Is there a deadline driving the sale (1031 exchange, divorce, estate, relocation)? That informs how much negotiation room exists.
- Schools are A-rated — typically a magnet for longer-tenancy family renters. What's the average tenant stay here, and is there a school-zone premium baked into asking?
- What's the average days-on-market for RENTAL listings here right now (not sales)? A rising rental-DOM trend means longer vacancies and softer asking-rent achievability than the comps imply.
- What's the recent tenant-quality profile in this submarket — average credit score on applications, eviction rate, late-payment / NSF rate, and stable-employment percentage? A property-management company in the area should have these aggregated.
- How much new apartment / multifamily construction is in the pipeline within 1–3 miles? Heavy new supply (>2% of stock underway) typically softens rents 12–24 months out; light construction supports rent growth.
CashFlowRE · CFR-SC0GG10692KSNP
· Data 2 days ago
cashflowre.app · 2026-05-29