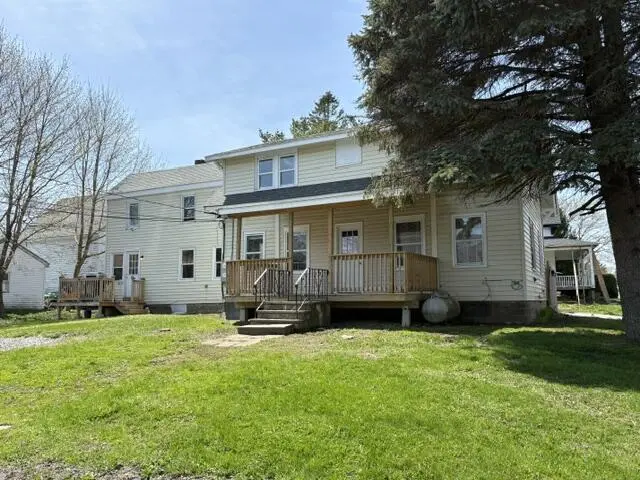
80 Pleasant St
Rockland, ME 04841
$350,000C-
6 bd · 2.0 ba ·
2,271 sqft ·
Built 1870
· MultiFamily
· Active
· 38 DOM
Cashflow @ list (25.0% down · 7.5%)
Estimated rent
$3,955/mo
Mortgage (P&I)
−$1,835
Tax + insurance
−$569
HOA
−$0
Vac / Maint / Mgmt
−$831
Net cashflow
$720/mo
Annual
$8,641/yr
Cap rate
8.76%
Cash-on-cash
8.82%
DSCR
1.39
1% rule
1.13%
Cash to close
$98,000
Investor read
- This is a 2 × 3-bed/1.0-bath units multifamily listed at $350k.
- At list price, monthly cash flow is $720 ($9k/yr) — positive. Per door: $360/mo.
- The deal already cash-flows at list — no discount required.
- Meets the 1% rule at list price ($4k rent vs $350k).
- It's been on market 38 days — a 3% lower offer ($340k) is reasonable based on typical stale-listing flexibility.
- Recommended offer: $340k (3.0% below list) — sets the bar for market timing.
- Local home prices are declining (-3.0%/yr); year-one equity from $2k of loan paydown is wiped out by about $10k of value loss. Plan a longer hold.
- Location reads 62/100 on livability (#116 in ME) — a middle-class / working-renter tenant base. Strengths: cost of living A+, housing A+, crime A-; Watch: schools D, amenities F, commute F.
- RSU 13 (town): math 77% / reading 85% proficiency, ranked #84 of 112 in ME (top 75%) — strong family-tenant draw, lease renewals of 3-5y typical.
- Watch-outs: built in 1870 — expect roof / HVAC / electrical / plumbing capex.
- Market conditions: 71 active listings in the ZIP; 160 units permitted in Knox County in 2024 (58 in 5+ unit buildings).
- Knox County population projected at -14% by 2050 — secular population decline; favor cash flow + early exit over multi-decade hold.
- 9 sale attempts since 23y ago with the ask held roughly flat each time — persistent listings suggest the price (not the market) is what's stuck; bring a comps-based counter.
- Current owner paid $175k; list at $350k implies a 100% gain — meaningful room to come down on a strong offer.
- Climate carrying-cost: major wind risk, 73% chance of damaging wind over 30y; extreme-heat days projected 7→17/yr by 2055 (HVAC capex compounding) — expect insurance premiums to compound above CPI over the hold.
- Cap rate 8.8% vs local median 3.3% in Rockland — top-decile yield for the area; either an underpriced asset or a hidden risk that comps aren't pricing in. Stress-test before assuming the spread holds.
- At $3,955/mo this rent would consume 84% of the median local household income ($57k/yr) (locally 279% of renters already pay >50% of income on rent) — very limited rent-growth headroom before tenants either downsize or default.
Questions for listing agent
- It's been on market 38 days. Have you received any prior offers? Is the seller open to a 3% concession, seller financing, or rate buy-down credit?
- Can we see the unit-by-unit rent roll, current vacancy, and any below-market leases? What's the average tenancy length?
- What capital expenditures (roof, boiler, parking lot, exteriors) have been made in the last 5 years, and what's planned in the next 2?
- Built in 1870 — when were the roof, HVAC, electrical panel, plumbing, and water heater last replaced?
- Is there a deadline driving the sale (1031 exchange, divorce, estate, relocation)? That informs how much negotiation room exists.
- Schools are D-rated, which usually means shorter tenancies and higher turnover. Who's the typical renter profile here, and what's been the actual vacancy rate?
- What's the average days-on-market for RENTAL listings here right now (not sales)? A rising rental-DOM trend means longer vacancies and softer asking-rent achievability than the comps imply.
- What's the recent tenant-quality profile in this submarket — average credit score on applications, eviction rate, late-payment / NSF rate, and stable-employment percentage? A property-management company in the area should have these aggregated.
CashFlowRE · CFR-SCMQ2C50M0DRQR
· Data 2 days ago
cashflowre.app · 2026-05-29