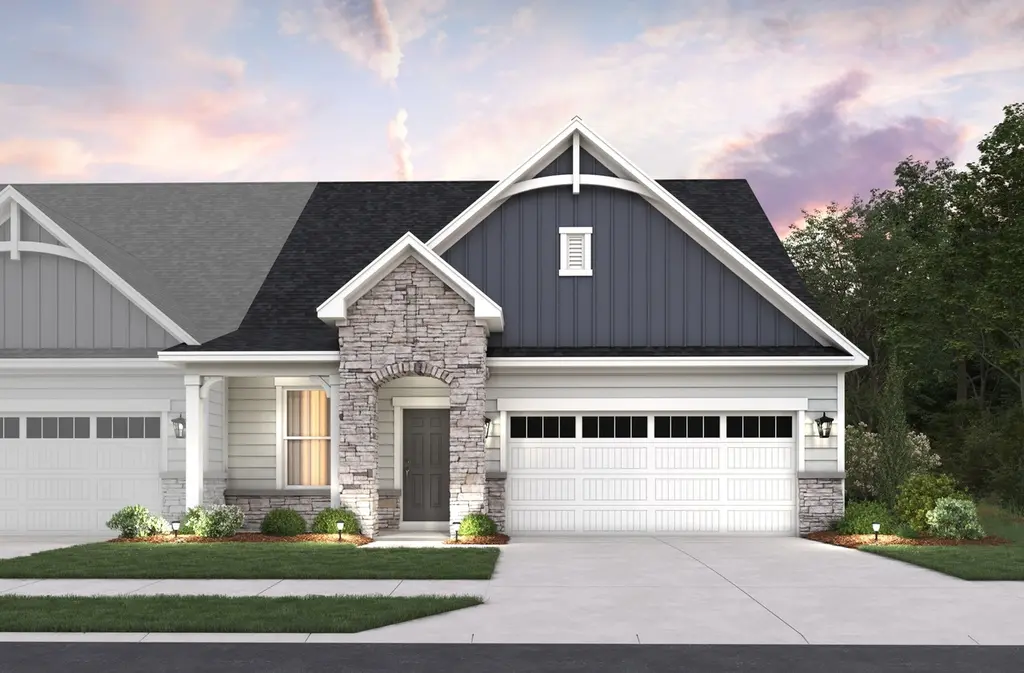
Vienna Plan
Noblesville, IN 46062
$380,990B
3 bd · 2.0 ba ·
2,302 sqft ·
Built —
· MultiFamily
· Active
· 190 DOM
Cashflow @ list (25.0% down · 7.5%)
Estimated rent
$4,335/mo
Mortgage (P&I)
−$1,670
Tax + insurance
−$531
HOA
−$0
Vac / Maint / Mgmt
−$910
Net cashflow
$1,223/mo
Annual
$14,679/yr
Cap rate
10.90%
Cash-on-cash
16.46%
DSCR
1.73
1% rule
1.36%
Cash to close
$89,193
Investor read
- This is a 3-bed/2.0-bath multifamily listed at $381k. Condition is rated good.
- At list price, monthly cash flow is $1k ($15k/yr) — positive.
- The deal already cash-flows at list — no discount required.
- Meets the 1% rule at list price ($4k rent vs $381k).
- It's been on market 190 days — a 12% lower offer ($335k) is reasonable based on typical stale-listing flexibility.
- Recommended offer: $335k (12.0% below list) — sets the bar for market timing.
- Local home prices are declining (-3.0%/yr); year-one equity from $2k of loan paydown is wiped out by about $10k of value loss. Plan a longer hold.
- Location reads 86/100 on livability (#3 in IN, #446 nationally) — a professional / high-income tenant draw. Strengths: crime A+, employment A+, cost of living A+; Watch: commute F.
- Noblesville Schools (suburban): math 51% / reading 57% proficiency, ranked #26 of 301 in IN (top 9%) — acceptable for families but not a draw, mixed tenant base, ~2y average lease; only 18% free/reduced lunch — higher-income household profile.
- Market conditions: Rents rising (+3.8%/yr); 414 active listings in the ZIP; 5 comparable units currently listed for rent nearby; rentals at typical pace (median 18d on market — plan ~3-4 weeks tenant-placement turnaround); 40% of comp listings sitting > 30 days — soft ceiling on asking rent; high-income renter base; 4,661 units permitted in Hamilton County in 2024 (1,528 in 5+ unit buildings).
- Hamilton County population projected at +44% by 2050 — long-run rental-demand tailwind backs the buy-and-hold thesis.
- At projected returns (-3.0% appreciation + 3.8% rent growth), your $89k cash investment doubles in ~7 years — after that, you're playing with house money.
- Cap rate 10.9% vs local median 3.2% in Noblesville — top-decile yield for the area; either an underpriced asset or a hidden risk that comps aren't pricing in. Stress-test before assuming the spread holds.
- This rent runs 43% of the median local income ($120k/yr) — at the standard rent-burdened threshold; future hikes will face affordability resistance.
Questions for listing agent
- It's been on market 190 days. Have you received any prior offers? Is the seller open to a 12% concession, seller financing, or rate buy-down credit?
- Why hasn't it sold? Are there any deal-killer items the seller is aware of (foundation, flood, title, zoning, code violations)?
- Is there a deadline driving the sale (1031 exchange, divorce, estate, relocation)? That informs how much negotiation room exists.
- Schools are B-rated — typically a magnet for longer-tenancy family renters. What's the average tenant stay here, and is there a school-zone premium baked into asking?
- What's the average days-on-market for RENTAL listings here right now (not sales)? A rising rental-DOM trend means longer vacancies and softer asking-rent achievability than the comps imply.
- What's the recent tenant-quality profile in this submarket — average credit score on applications, eviction rate, late-payment / NSF rate, and stable-employment percentage? A property-management company in the area should have these aggregated.
- How much new apartment / multifamily construction is in the pipeline within 1–3 miles? Heavy new supply (>2% of stock underway) typically softens rents 12–24 months out; light construction supports rent growth.
CashFlowRE · CFR-SHPGABF03EE3VG
· Data 2 days ago
cashflowre.app · 2026-05-29