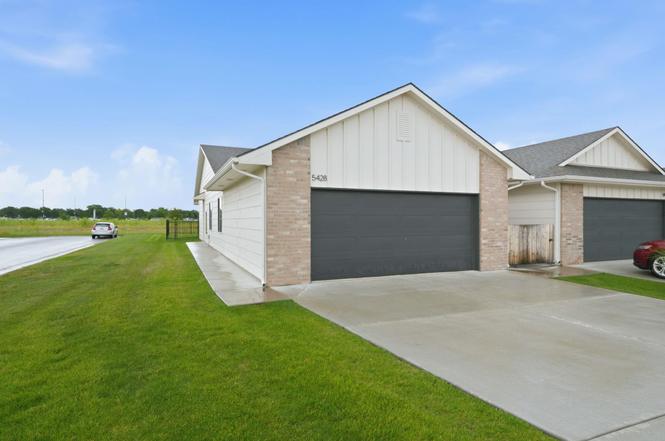
5428 N Sandkey
Wichita, KS 67204
$201,000D-
4 bd · 2.0 ba ·
1,364 sqft ·
Built 2023
· SingleFamily
· Active
· 1 DOM
Cashflow @ list (25.0% down · 7.5%)
Estimated rent
$1,827/mo
Mortgage (P&I)
−$1,054
Tax + insurance
−$335
HOA
−$71
Vac / Maint / Mgmt
−$384
Net cashflow
$-17/mo
Annual
$-201/yr
Cap rate
6.19%
Cash-on-cash
-0.36%
DSCR
0.98
1% rule
0.91%
Cash to close
$56,280
Investor read
- This is a 4-bed/2.0-bath single-family listed at $201k.
- At list price, monthly cash flow is $-17 ($-201/yr) — negative.
- To cash-flow at today's rent, offer at most $199k (1.2% below list).
- To meet the 1% rule (rent ≥ 1% of price), the offer needs to be $183k (9.1% below list).
- Only 1 days on market — expect competitive offers; lowballing is unlikely to land.
- Recommended offer: $183k (9.1% below list) — sets the bar for 1% rule.
- Local home prices are declining (-3.0%/yr); year-one equity from $1k of loan paydown is wiped out by about $6k of value loss. Plan a longer hold.
- Location reads 72/100 on livability (#100 in KS) — a middle-class / working-renter tenant base. Strengths: amenities A+, cost of living A+, housing A+; Watch: employment D+, crime F, commute F.
- Valley Center Pub Schools (suburban): math 30% / reading 37% proficiency, ranked #57 of 169 in KS (top 34%) — families likely to look elsewhere, expect single-tenant / working-renter base with shorter leases.
- Zoned schools: West Elem (math 47% / reading 42%, grade F, #228 of 684 statewide, top 38%, 287 students, 47% FRL); Valley Center Middle School (math 23% / reading 28%, grade F, #104 of 219 statewide, top 49%, 761 students, 42% FRL); Valley Center High (math 22% / reading 22%, grade F, #165 of 327 statewide, top 55%, 995 students, 34% FRL).
- Market conditions: 60 active listings in the ZIP; 1 comparable units currently listed for rent nearby; 2,613 units permitted in Sedgwick County in 2024 (258 in 5+ unit buildings).
- Sedgwick County population projected at +5% by 2050 — modest demand growth; plan on rents tracking national, not racing it.
- 3 sale attempts since 2y ago with the ask held roughly flat each time — persistent listings suggest the price (not the market) is what's stuck; bring a comps-based counter.
- Climate carrying-cost: extreme-heat days projected 7→19/yr by 2055 (HVAC capex compounding) — expect insurance premiums to compound above CPI over the hold.
- This rent runs 30% of the median local income ($72k/yr) — at the standard rent-burdened threshold; future hikes will face affordability resistance.
Questions for listing agent
- What do current leases actually rent for vs. the listed asking? Can we see a recent rent roll and the last 12 months of T-12 income?
- What does the HOA fee cover, when was the last increase, and are there any pending special assessments or reserve-fund shortfalls?
- Is there a deadline driving the sale (1031 exchange, divorce, estate, relocation)? That informs how much negotiation room exists.
- Schools are F-rated, which usually means shorter tenancies and higher turnover. Who's the typical renter profile here, and what's been the actual vacancy rate?
- Crime grade is F in this area — have there been break-ins, vandalism, or insurance claims at this property in the last 3 years? What carrier currently insures it and at what premium?
- The area grade is low — what's the realistic commute time and amenity access for the typical tenant pool here? Any planned neighborhood developments (good or bad) we should know about?
- What's the average days-on-market for RENTAL listings here right now (not sales)? A rising rental-DOM trend means longer vacancies and softer asking-rent achievability than the comps imply.
- What's the recent tenant-quality profile in this submarket — average credit score on applications, eviction rate, late-payment / NSF rate, and stable-employment percentage? A property-management company in the area should have these aggregated.
CashFlowRE · CFR-SHSXH710FRX1VT
· Data 9 h ago
cashflowre.app · 2026-05-29