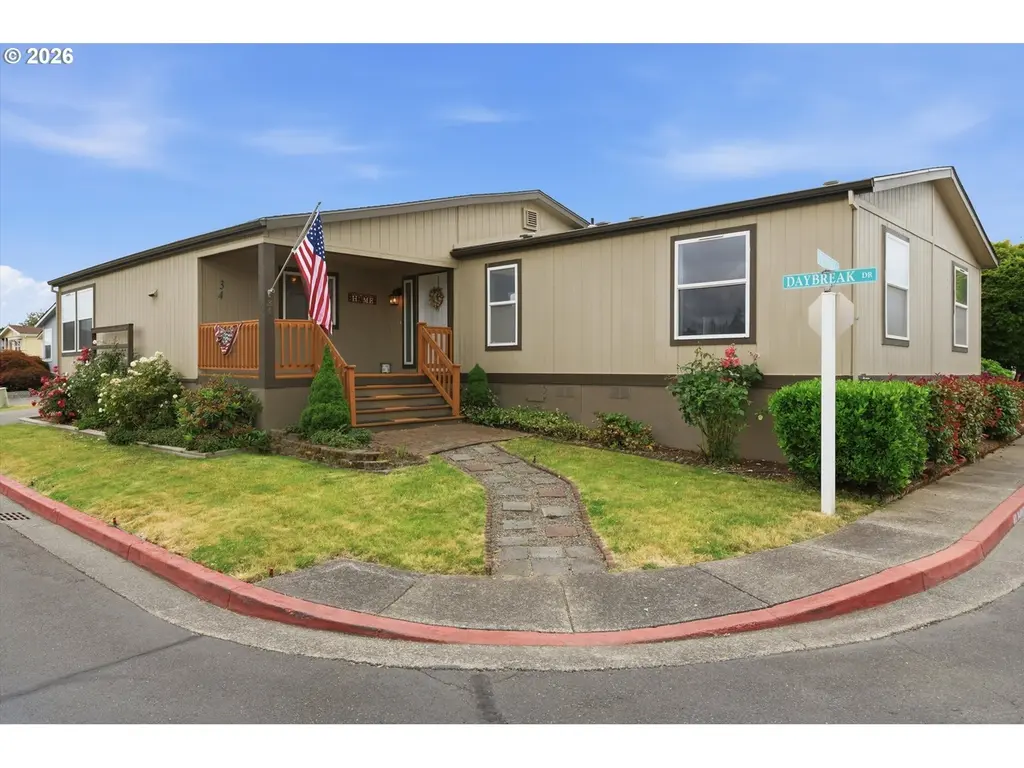
1000 S Mckern Ct #34
Newberg, OR 97132
$174,900B-
3 bd · 2.0 ba ·
1,984 sqft ·
Built 1995
· Manufactured
· Pending
· 9 DOM
Cashflow @ list (25.0% down · 7.5%)
Estimated rent
$2,430/mo
Mortgage (P&I)
−$917
Tax + insurance
−$190
HOA
−$0
Vac / Maint / Mgmt
−$510
Net cashflow
$813/mo
Annual
$9,752/yr
Cap rate
11.87%
Cash-on-cash
19.91%
DSCR
1.89
1% rule
1.39%
Cash to close
$48,972
Investor read
- This is a 3-bed/2.0-bath manufactured listed at $175k.
- At list price, monthly cash flow is $813 ($10k/yr) — positive.
- The deal already cash-flows at list — no discount required.
- Meets the 1% rule at list price ($2k rent vs $175k).
- Only 9 days on market — expect competitive offers; lowballing is unlikely to land.
- Local home prices are declining (-3.0%/yr); year-one equity from $1k of loan paydown is wiped out by about $5k of value loss. Plan a longer hold.
- Location reads 76/100 on livability (#77 in OR, #3,395 nationally) — a middle-class / working-renter tenant base. Strengths: amenities A+, employment A+, housing A+; Watch: cost of living D, commute F.
- Newberg SD 29J (town): math 30% / reading 45% proficiency, ranked #17 of 58 in OR (top 29%) — families likely to look elsewhere, expect single-tenant / working-renter base with shorter leases.
- Zoned schools: Mabel Rush Elementary School (math 44% / reading 44%, grade F, #143 of 412 statewide, top 38%, 389 students, 38% FRL); Mountain View Middle School (math 29% / reading 44%, grade F, #54 of 128 statewide, top 42%, 498 students, 99% FRL); Newberg Senior High School (math 24% / reading 74%, grade D, #50 of 143 statewide, top 37%, 1,389 students, 31% FRL) — zoned schools average 56% FRL vs 36% district-wide (20 pts higher); higher-poverty schools than district average — tighter screening recommended.
- Market conditions: Rents flat; 238 active listings in the ZIP; 8 comparable units currently listed for rent nearby; rentals at typical pace (median 19d on market — plan ~3-4 weeks tenant-placement turnaround); solid renter incomes; 282 units permitted in Yamhill County in 2024 (0 in 5+ unit buildings).
- Yamhill County population projected at +8% by 2050 — modest demand growth; plan on rents tracking national, not racing it.
- 3 sale attempts since 13y ago with the ask held roughly flat each time — persistent listings suggest the price (not the market) is what's stuck; bring a comps-based counter.
- At projected returns (-3.0% appreciation + 0.6% rent growth), your $49k cash investment doubles in ~8 years — after that, you're playing with house money.
- Cap rate 11.9% vs local median 2.4% in Newberg — top-decile yield for the area; either an underpriced asset or a hidden risk that comps aren't pricing in. Stress-test before assuming the spread holds.
- This rent runs 30% of the median local income ($96k/yr) — at the standard rent-burdened threshold; future hikes will face affordability resistance.
Questions for listing agent
- Is there a deadline driving the sale (1031 exchange, divorce, estate, relocation)? That informs how much negotiation room exists.
- Schools are B-rated — typically a magnet for longer-tenancy family renters. What's the average tenant stay here, and is there a school-zone premium baked into asking?
- What's the average days-on-market for RENTAL listings here right now (not sales)? A rising rental-DOM trend means longer vacancies and softer asking-rent achievability than the comps imply.
- What's the recent tenant-quality profile in this submarket — average credit score on applications, eviction rate, late-payment / NSF rate, and stable-employment percentage? A property-management company in the area should have these aggregated.
- How much new for-sale + rental construction is in the pipeline within 1–3 miles? Heavy new supply typically softens prices + rents 12–24 months out; constrained supply supports both.
CashFlowRE · CFR-SJYBB86CTVN13T
· Data 3 days ago
cashflowre.app · 2026-05-29