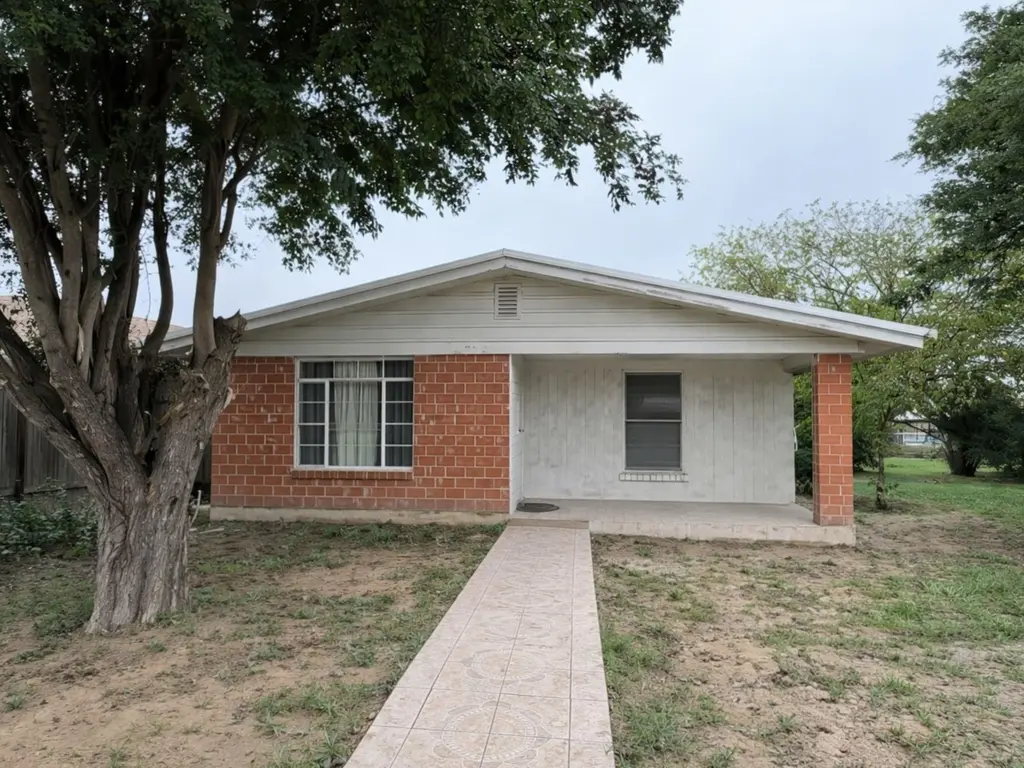
708 Elm St
Zapata, TX 78076
$139,900C-
3 bd · 2.0 ba ·
1,272 sqft ·
Built 1963
· SingleFamily
· Active
· 154 DOM
Cashflow @ list (25.0% down · 7.5%)
Estimated rent
$1,138/mo
Mortgage (P&I)
−$734
Tax + insurance
−$173
HOA
−$0
Vac / Maint / Mgmt
−$239
Net cashflow
$-8/mo
Annual
$-92/yr
Cap rate
6.23%
Cash-on-cash
-0.23%
DSCR
0.99
1% rule
0.81%
Cash to close
$39,172
Investor read
- This is a 3-bed/2.0-bath single-family listed at $140k.
- At list price, monthly cash flow is $-8 ($-92/yr) — negative.
- To cash-flow at today's rent, offer at most $139k (1.0% below list).
- To meet the 1% rule (rent ≥ 1% of price), the offer needs to be $114k (18.7% below list).
- It's been on market 154 days — a 12% lower offer ($123k) is reasonable based on typical stale-listing flexibility.
- Recommended offer: $114k (18.7% below list) — sets the bar for 1% rule.
- In year one you build about $5k of equity ($967 loan paydown + $4k appreciation (2.6% local appreciation)).
- Location reads 62/100 on livability (#903 in TX) — a middle-class / working-renter tenant base. Strengths: cost of living A+, housing A+; Watch: crime D, amenities F, commute F.
- Zapata County ISD (town): math 21% / reading 24% proficiency, ranked #767 of 826 in TX (top 93%) — low school quality limits family demand, transient renter base, plan for 1-2y turnover; 70% free/reduced lunch — lower-income household profile, screen leases tightly.
- Zoned schools: Zapata North El (math 32% / reading 27%, grade F, #2,525 of 4,322 statewide, top 62%, 581 students, 91% FRL); Zapata Middle (math 15% / reading 25%, grade F, #1,428 of 1,662 statewide, top 87%, 784 students, 83% FRL); Zapata H S (math 25% / reading 23%, grade F, #1,333 of 1,632 statewide, top 82%, 1,034 students, 87% FRL) — zoned schools average 87% FRL vs 70% district-wide (17 pts higher); higher-poverty schools than district average — tighter screening recommended.
- Market conditions: 92 active listings in the ZIP.
- Zapata County population projected to shrink 3% by 2050 — rents likely to lag national; underwrite the cash flow, not the appreciation.
- 4 sale attempts since 3y ago with the ask held roughly flat each time — persistent listings suggest the price (not the market) is what's stuck; bring a comps-based counter.
- At projected returns (2.6% appreciation + 3.0% rent growth), your $39k cash investment doubles in ~7 years — after that, you're playing with house money.
- By year 8, paydown + projected appreciation supports a ~$34k cash-out refi (75% LTV) — recoverable capital for the next deal without selling this one.
- Climate carrying-cost: major wind risk, 64% chance of damaging wind over 30y; severe wildfire risk; extreme-heat days projected 7→21/yr by 2055 (HVAC capex compounding) — expect insurance premiums to compound above CPI over the hold.
Questions for listing agent
- What do current leases actually rent for vs. the listed asking? Can we see a recent rent roll and the last 12 months of T-12 income?
- It's been on market 154 days. Have you received any prior offers? Is the seller open to a 19% concession, seller financing, or rate buy-down credit?
- Built in 1963 — when were the roof, HVAC, electrical panel, plumbing, and water heater last replaced?
- Why hasn't it sold? Are there any deal-killer items the seller is aware of (foundation, flood, title, zoning, code violations)?
- Is there a deadline driving the sale (1031 exchange, divorce, estate, relocation)? That informs how much negotiation room exists.
- Schools are F-rated, which usually means shorter tenancies and higher turnover. Who's the typical renter profile here, and what's been the actual vacancy rate?
- Crime grade is D in this area — have there been break-ins, vandalism, or insurance claims at this property in the last 3 years? What carrier currently insures it and at what premium?
- What's the average days-on-market for RENTAL listings here right now (not sales)? A rising rental-DOM trend means longer vacancies and softer asking-rent achievability than the comps imply.
CashFlowRE · CFR-SK9ABQ9P4J2RHT
· Data 19 h ago
cashflowre.app · 2026-05-29