None
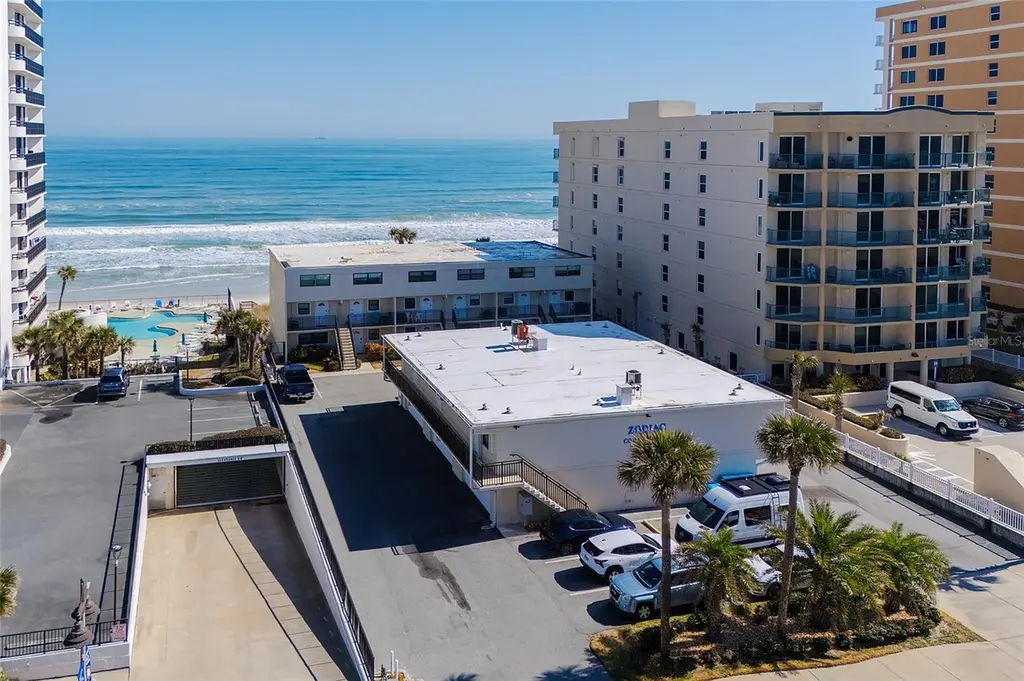
Daytona Beach Shores, FL 32118
$195,000D
2 bd · 1.0 ba ·
1,012 sqft ·
Built 1972
· Condo
· Pending
· 45 DOM
Cashflow @ list (25.0% down · 7.5%)
Estimated rent
$2,489/mo
Mortgage (P&I)
−$1,023
Tax + insurance
−$350
HOA
−$695
Vac / Maint / Mgmt
−$523
Net cashflow
$-101/mo
Annual
$-1,217/yr
Cap rate
5.67%
Cash-on-cash
-2.23%
DSCR
0.90
1% rule
1.28%
Cash to close
$54,600
Investor read
- This is a 2-bed/1.0-bath condo listed at $195k.
- At list price, monthly cash flow is $-101 ($-1k/yr) — negative.
- To cash-flow at today's rent, offer at most $177k (9.2% below list).
- Meets the 1% rule at list price ($2k rent vs $195k).
- It's been on market 45 days — a 3% lower offer ($189k) is reasonable based on typical stale-listing flexibility.
- Recommended offer: $177k (9.2% below list) — sets the bar for cash-flow.
- Local home prices are declining (-3.0%/yr); year-one equity from $1k of loan paydown is wiped out by about $6k of value loss. Plan a longer hold.
- Location reads 77/100 on livability (#201 in FL, #3,146 nationally) — a middle-class / working-renter tenant base. Strengths: crime A+, commute A+, health & safety A; Watch: schools C-, cost of living C-, amenities D-.
- Volusia (suburban): math 44% / reading 49% proficiency, ranked #47 of 73 in FL (top 64%) — families likely to look elsewhere, expect single-tenant / working-renter base with shorter leases.
- Watch-outs: HOA is 28% of rent.
- Market conditions: Rents soft (-0.2%/yr); 920 active listings in the ZIP; 11 comparable units currently listed for rent nearby; rentals at typical pace (median 15d on market — plan ~3-4 weeks tenant-placement turnaround); 3,402 units permitted in Volusia County in 2024 (681 in 5+ unit buildings).
- Volusia County population projected at +19% by 2050 — long-run rental-demand tailwind backs the buy-and-hold thesis.
- 5 sale attempts since 2y ago; this cycle's ask has dropped $14k (7%) from the opening price — seller is motivated, your offer sets the floor, not the list.
- Current owner paid $122k; list at $195k implies a 60% gain — meaningful room to come down on a strong offer.
- Climate carrying-cost: severe wind risk, 99% chance of damaging wind over 30y; extreme-heat days projected 7→18/yr by 2055 (HVAC capex compounding) — expect insurance premiums to compound above CPI over the hold.
- At $2,489/mo this rent would consume 49% of the median local household income ($61k/yr) (locally 937% of renters already pay >50% of income on rent) — very limited rent-growth headroom before tenants either downsize or default.
Questions for listing agent
- What do current leases actually rent for vs. the listed asking? Can we see a recent rent roll and the last 12 months of T-12 income?
- It's been on market 45 days. Have you received any prior offers? Is the seller open to a 9% concession, seller financing, or rate buy-down credit?
- Built in 1972 — when were the roof, HVAC, electrical panel, plumbing, and water heater last replaced?
- What does the HOA fee cover, when was the last increase, and are there any pending special assessments or reserve-fund shortfalls?
- Any open or pending special assessments — roof, HVAC, plumbing, elevator, façade? What's the per-unit balance and payoff schedule, and is the seller paying it off at close or rolling it to the buyer?
- Is there a deadline driving the sale (1031 exchange, divorce, estate, relocation)? That informs how much negotiation room exists.
- The area grade is low — what's the realistic commute time and amenity access for the typical tenant pool here? Any planned neighborhood developments (good or bad) we should know about?
- What's the average days-on-market for RENTAL listings here right now (not sales)? A rising rental-DOM trend means longer vacancies and softer asking-rent achievability than the comps imply.
CashFlowRE · CFR-SSEGSX2WH2RW6H
· Data 2 weeks ago
cashflowre.app · 2026-05-29