505 W 40th St
Indianapolis city (balance), IN 46208
$150,000B
5 bd · 4.0 ba ·
3,744 sqft ·
Built 1915
· MultiFamily
· Active
· 412 DOM
Cashflow @ list (25.0% down · 7.5%)
Estimated rent
$3,576/mo
Mortgage (P&I)
−$787
Tax + insurance
−$250
HOA
−$0
Vac / Maint / Mgmt
−$751
Net cashflow
$1,788/mo
Annual
$21,461/yr
Cap rate
20.60%
Cash-on-cash
51.10%
DSCR
3.27
1% rule
2.38%
Cash to close
$42,000
Investor read
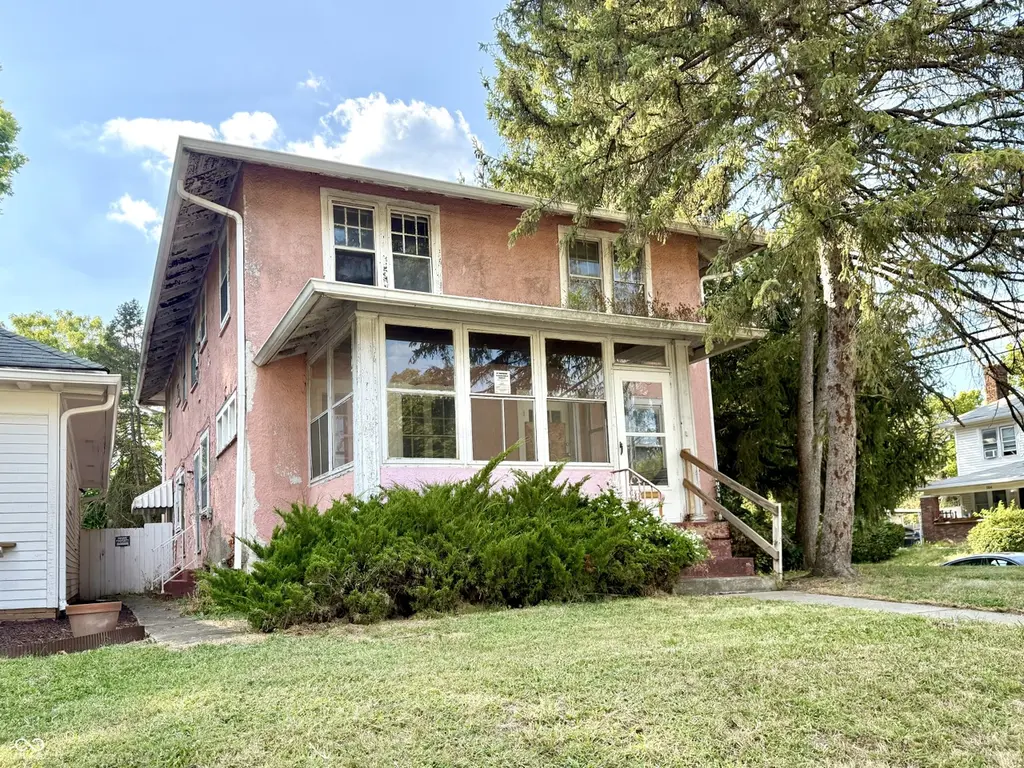
- This is a 5-bed/4.0-bath multifamily listed at $150k. Condition is rated poor.
- At list price, monthly cash flow is $2k ($21k/yr) — positive.
- The deal already cash-flows at list — no discount required.
- Meets the 1% rule at list price ($4k rent vs $150k).
- It's been on market 412 days — a 12% lower offer ($132k) is reasonable based on typical stale-listing flexibility.
- Recommended offer: $132k (12.0% below list) — sets the bar for market timing.
- Local home prices are declining (-3.0%/yr); year-one equity from $1k of loan paydown is wiped out by about $4k of value loss. Plan a longer hold.
- Location reads: area grade B — affects rentability + tenant quality, not the cash-flow math above.
- Indianapolis Public Schools (urban): math 14% / reading 20% proficiency, ranked #286 of 301 in IN (top 95%) — low school quality limits family demand, transient renter base, plan for 1-2y turnover; 77% free/reduced lunch — lower-income household profile, screen leases tightly.
- Watch-outs: built in 1915 — expect roof / HVAC / electrical / plumbing capex.
- Market conditions: Rents rising fast (+6.4%/yr); 279 active listings in the ZIP; 2 comparable units currently listed for rent nearby; 1,906 units permitted in Marion County in 2024 (621 in 5+ unit buildings).
- Marion County population projected at +18% by 2050 — long-run rental-demand tailwind backs the buy-and-hold thesis.
- 3 sale attempts; this cycle's ask has dropped $100k (40%) from the opening price — seller is motivated, your offer sets the floor, not the list.
- At projected returns (-3.0% appreciation + 6.4% rent growth), your $42k cash investment doubles in ~3 years — after that, you're playing with house money.
- Cap rate 20.6% vs local median 4.4% in Indianapolis city (balance) — top-decile yield for the area; either an underpriced asset or a hidden risk that comps aren't pricing in. Stress-test before assuming the spread holds.
- At $3,576/mo this rent would consume 71% of the median local household income ($60k/yr) (locally 978% of renters already pay >50% of income on rent) — very limited rent-growth headroom before tenants either downsize or default.
Questions for listing agent
- It's been on market 412 days. Have you received any prior offers? Is the seller open to a 12% concession, seller financing, or rate buy-down credit?
- Have any recent inspections been done? Can we get a copy of the seller's disclosures and any deferred-maintenance estimates?
- Built in 1915 — when were the roof, HVAC, electrical panel, plumbing, and water heater last replaced?
- Why hasn't it sold? Are there any deal-killer items the seller is aware of (foundation, flood, title, zoning, code violations)?
- Is there a deadline driving the sale (1031 exchange, divorce, estate, relocation)? That informs how much negotiation room exists.
- What's the average days-on-market for RENTAL listings here right now (not sales)? A rising rental-DOM trend means longer vacancies and softer asking-rent achievability than the comps imply.
- What's the recent tenant-quality profile in this submarket — average credit score on applications, eviction rate, late-payment / NSF rate, and stable-employment percentage? A property-management company in the area should have these aggregated.
- How much new apartment / multifamily construction is in the pipeline within 1–3 miles? Heavy new supply (>2% of stock underway) typically softens rents 12–24 months out; light construction supports rent growth.
Repairs flagged (vision-AI assessment)
- Major: exterior siding — Significant damage and peeling
- Major: paint — Peeling and deteriorating
- Major: roof — No photos, but given the exterior condition, likely in poor shape
CashFlowRE · CFR-ST3GCD5XGF97Q0
· Data 2 days ago
cashflowre.app · 2026-05-29