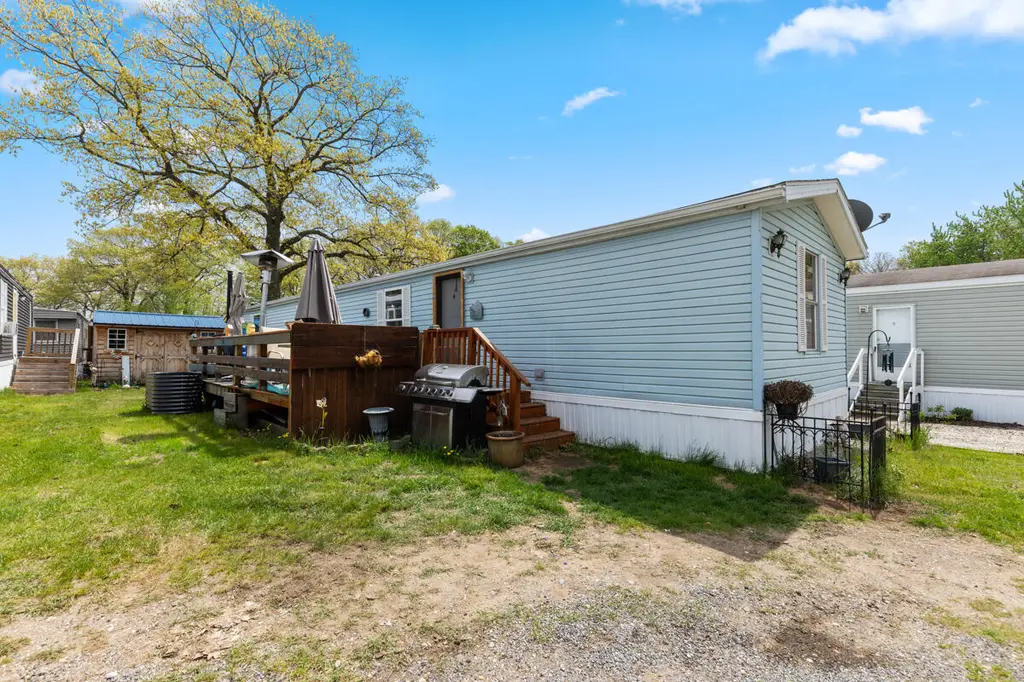
10845 Percy Ln #33
Canadian Lakes, MI 49332
$45,000D
2 bd · 2.0 ba ·
980 sqft ·
Built 1991
· SingleFamily
· Active
· 123 DOM
Cashflow @ list (25.0% down · 7.5%)
Estimated rent
$879/mo
Mortgage (P&I)
−$236
Tax + insurance
−$75
HOA
−$400
Vac / Maint / Mgmt
−$185
Net cashflow
$-16/mo
Annual
$-197/yr
Cap rate
5.86%
Cash-on-cash
-1.56%
DSCR
0.93
1% rule
1.95%
Cash to close
$12,600
Investor read
- This is a 2-bed/2.0-bath single-family listed at $45k. Condition is rated fair.
- At list price, monthly cash flow is $-16 ($-197/yr) — negative.
- To cash-flow at today's rent, offer at most $43k (5.3% below list).
- Meets the 1% rule at list price ($879 rent vs $45k).
- It's been on market 123 days — a 12% lower offer ($40k) is reasonable based on typical stale-listing flexibility.
- Recommended offer: $40k (12.0% below list) — sets the bar for market timing.
- Local home prices are declining (-3.0%/yr); year-one equity from $311 of loan paydown is wiped out by about $1k of value loss. Plan a longer hold.
- Location reads 62/100 on livability (#541 in MI) — a middle-class / working-renter tenant base. Strengths: crime A+, cost of living A+, housing A+; Watch: amenities F, commute F, health & safety F.
- Chippewa Hills School District (rural): math 24% / reading 42% proficiency, ranked #324 of 540 in MI (top 60%) — families likely to look elsewhere, expect single-tenant / working-renter base with shorter leases.
- Zoned schools: Mecosta Elementary School (math 42% / reading 52%, grade D-, #433 of 1,397 statewide, top 34%, 228 students, 66% FRL); Chippewa Hills Intermediate School (math 17% / reading 37%, grade F, #372 of 493 statewide, top 77%, 513 students, 69% FRL); Chippewa Hills High School (math 27% / reading 57%, grade F, #264 of 713 statewide, top 41%, 476 students, 59% FRL).
- Watch-outs: HOA is 45% of rent.
- Market conditions: 33 active listings in the ZIP; 116 units permitted in Mecosta County in 2024 (0 in 5+ unit buildings).
- Mecosta County population projected to shrink 9% by 2050 — rents likely to lag national; underwrite the cash flow, not the appreciation.
- 7 sale attempts since 4y ago with the ask held roughly flat each time — persistent listings suggest the price (not the market) is what's stuck; bring a comps-based counter.
- Cap rate 5.9% vs local median 2.0% in Canadian Lakes — top-decile yield for the area; either an underpriced asset or a hidden risk that comps aren't pricing in. Stress-test before assuming the spread holds.
Questions for listing agent
- What do current leases actually rent for vs. the listed asking? Can we see a recent rent roll and the last 12 months of T-12 income?
- It's been on market 123 days. Have you received any prior offers? Is the seller open to a 12% concession, seller financing, or rate buy-down credit?
- Have any recent inspections been done? Can we get a copy of the seller's disclosures and any deferred-maintenance estimates?
- What does the HOA fee cover, when was the last increase, and are there any pending special assessments or reserve-fund shortfalls?
- Why hasn't it sold? Are there any deal-killer items the seller is aware of (foundation, flood, title, zoning, code violations)?
- Is there a deadline driving the sale (1031 exchange, divorce, estate, relocation)? That informs how much negotiation room exists.
- The area grade is low — what's the realistic commute time and amenity access for the typical tenant pool here? Any planned neighborhood developments (good or bad) we should know about?
- What's the average days-on-market for RENTAL listings here right now (not sales)? A rising rental-DOM trend means longer vacancies and softer asking-rent achievability than the comps imply.
Repairs flagged (vision-AI assessment)
- Moderate: Kitchen cabinets — Worn condition
- Moderate: Kitchen countertops — Worn condition
- Moderate: Bathroom fixtures — Signs of wear
- Moderate: Exterior siding — Aged appearance
- Moderate: Paint — Faded in some areas
- Moderate: Windows — Signs of wear
CashFlowRE · CFR-SXEZ4PFMYAMB3N
· Data 2 days ago
cashflowre.app · 2026-05-29