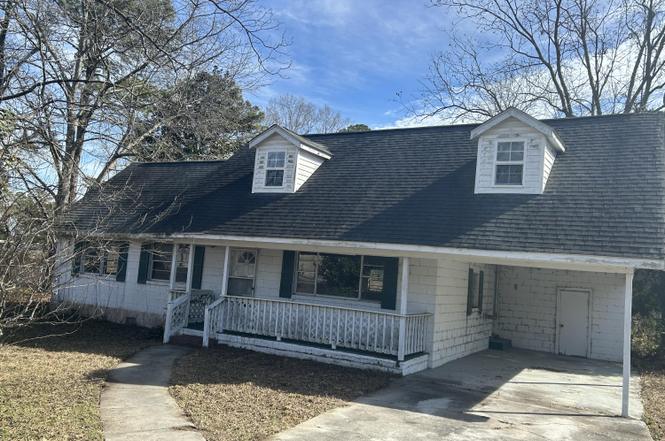
1523 Trojan Rd
Wyboo, SC 29436
$150,000C
2 bd · 2.0 ba ·
1,218 sqft ·
Built 1990
· SingleFamily
· Active
· 48 DOM
Cashflow @ list (25.0% down · 7.5%)
Estimated rent
$1,524/mo
Mortgage (P&I)
−$787
Tax + insurance
−$185
HOA
−$0
Vac / Maint / Mgmt
−$320
Net cashflow
$232/mo
Annual
$2,789/yr
Cap rate
8.15%
Cash-on-cash
6.64%
DSCR
1.30
1% rule
1.02%
Cash to close
$42,000
Investor read
- This is a 2-bed/2.0-bath single-family listed at $150k.
- At list price, monthly cash flow is $232 ($3k/yr) — positive.
- The deal already cash-flows at list — no discount required.
- Meets the 1% rule at list price ($2k rent vs $150k).
- It's been on market 48 days — a 3% lower offer ($146k) is reasonable based on typical stale-listing flexibility.
- Recommended offer: $146k (3.0% below list) — sets the bar for market timing.
- In year one you build about $6k of equity ($1k loan paydown + $5k appreciation (3.6% local appreciation)).
- Location reads: area grade C — affects rentability + tenant quality, not the cash-flow math above.
- Berkeley 01 (suburban): math 35% / reading 48% proficiency, ranked #30 of 80 in SC (top 38%) — families likely to look elsewhere, expect single-tenant / working-renter base with shorter leases.
- Zoned schools: Cross Elementary (math 8% / reading 27%, grade F, #514 of 597 statewide, top 86%, 348 students, 100% FRL); Cross High (math 12% / reading 42%, grade F, #193 of 196 statewide, top 98%, 294 students, 100% FRL) — zoned schools average 100% FRL vs 48% district-wide (52 pts higher); higher-poverty schools than district average — tighter screening recommended.
- Zoned-school proficiency averages 22% at this address vs 42% district-wide (-19 pts) — the specific schools serving this property underperform the Berkeley 01 average; the district grade overstates school quality for this exact location.
- Market conditions: 62 active listings in the ZIP; 3,183 units permitted in Berkeley County in 2024 (580 in 5+ unit buildings).
- Berkeley County population projected at +48% by 2050 — long-run rental-demand tailwind backs the buy-and-hold thesis.
- 2 sale attempts with the ask held roughly flat each time — persistent listings suggest the price (not the market) is what's stuck; bring a comps-based counter.
- At projected returns (3.6% appreciation + 3.0% rent growth), your $42k cash investment doubles in ~5 years — after that, you're playing with house money.
- By year 6, paydown + projected appreciation supports a ~$34k cash-out refi (75% LTV) — recoverable capital for the next deal without selling this one.
- Climate carrying-cost: severe wind risk, 80% chance of damaging wind over 30y; severe wildfire risk; extreme-heat days projected 7→17/yr by 2055 (HVAC capex compounding) — expect insurance premiums to compound above CPI over the hold.
Questions for listing agent
- It's been on market 48 days. Have you received any prior offers? Is the seller open to a 3% concession, seller financing, or rate buy-down credit?
- Is there a deadline driving the sale (1031 exchange, divorce, estate, relocation)? That informs how much negotiation room exists.
- What's the average days-on-market for RENTAL listings here right now (not sales)? A rising rental-DOM trend means longer vacancies and softer asking-rent achievability than the comps imply.
- What's the recent tenant-quality profile in this submarket — average credit score on applications, eviction rate, late-payment / NSF rate, and stable-employment percentage? A property-management company in the area should have these aggregated.
- How much new for-sale + rental construction is in the pipeline within 1–3 miles? Heavy new supply typically softens prices + rents 12–24 months out; constrained supply supports both.
CashFlowRE · CFR-SXYHRJANWCJAB7
· Data 19 h ago
cashflowre.app · 2026-05-29