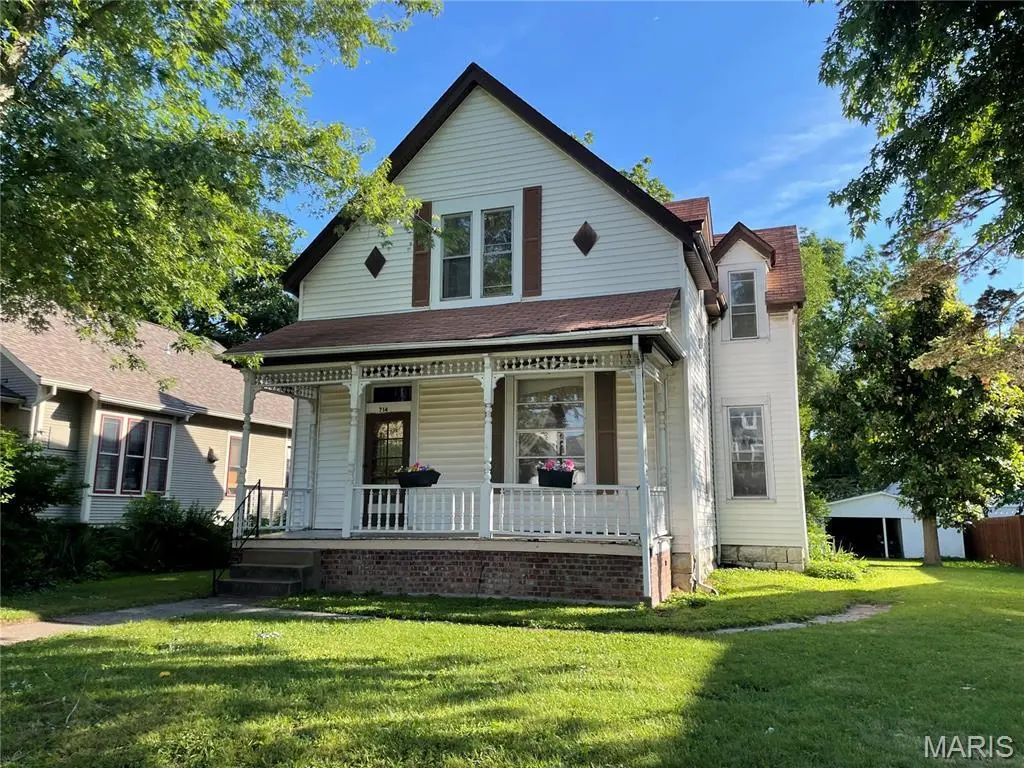
714 Monroe St
St. Charles, MO 63301
$227,000B
2 bd · 3.0 ba ·
1,997 sqft ·
Built 1900
· MultiFamily
· Coming Soon
· 1 DOM
Cashflow @ list (25.0% down · 7.5%)
Estimated rent
$3,548/mo
Mortgage (P&I)
−$1,190
Tax + insurance
−$343
HOA
−$0
Vac / Maint / Mgmt
−$745
Net cashflow
$1,270/mo
Annual
$15,235/yr
Cap rate
13.00%
Cash-on-cash
23.97%
DSCR
2.07
1% rule
1.56%
Cash to close
$63,560
Investor read
- This is a 2-bed/3.0-bath multifamily listed at $227k.
- At list price, monthly cash flow is $1k ($15k/yr) — positive.
- The deal already cash-flows at list — no discount required.
- Meets the 1% rule at list price ($4k rent vs $227k).
- Only 1 days on market — expect competitive offers; lowballing is unlikely to land.
- Local home prices are declining (-3.0%/yr); year-one equity from $2k of loan paydown is wiped out by about $7k of value loss. Plan a longer hold.
- Location reads: area grade B — affects rentability + tenant quality, not the cash-flow math above.
- St. Charles R-VI (urban): math 44% / reading 52% proficiency, ranked #51 of 324 in MO (top 16%) — families likely to look elsewhere, expect single-tenant / working-renter base with shorter leases.
- Watch-outs: built in 1900 — expect roof / HVAC / electrical / plumbing capex.
- Market conditions: Rents rising (+3.2%/yr); 294 active listings in the ZIP; 2 comparable units currently listed for rent nearby; solid renter incomes; 2,021 units permitted in St. Charles County in 2024 (568 in 5+ unit buildings).
- St. Charles County population projected at +22% by 2050 — long-run rental-demand tailwind backs the buy-and-hold thesis.
- At projected returns (-3.0% appreciation + 3.2% rent growth), your $64k cash investment doubles in ~6 years — after that, you're playing with house money.
- Climate carrying-cost: extreme-heat days projected 7→20/yr by 2055 (HVAC capex compounding) — expect insurance premiums to compound above CPI over the hold.
- Cap rate 13.0% vs local median 3.3% in St. Charles — top-decile yield for the area; either an underpriced asset or a hidden risk that comps aren't pricing in. Stress-test before assuming the spread holds.
- At $3,548/mo this rent would consume 50% of the median local household income ($85k/yr) (locally 1118% of renters already pay >50% of income on rent) — very limited rent-growth headroom before tenants either downsize or default.
Questions for listing agent
- Built in 1900 — when were the roof, HVAC, electrical panel, plumbing, and water heater last replaced?
- Is there a deadline driving the sale (1031 exchange, divorce, estate, relocation)? That informs how much negotiation room exists.
- What's the average days-on-market for RENTAL listings here right now (not sales)? A rising rental-DOM trend means longer vacancies and softer asking-rent achievability than the comps imply.
- What's the recent tenant-quality profile in this submarket — average credit score on applications, eviction rate, late-payment / NSF rate, and stable-employment percentage? A property-management company in the area should have these aggregated.
- How much new apartment / multifamily construction is in the pipeline within 1–3 miles? Heavy new supply (>2% of stock underway) typically softens rents 12–24 months out; light construction supports rent growth.
CashFlowRE · CFR-T0JS6R7B6NJ7H9
· Data 1 day ago
cashflowre.app · 2026-05-29