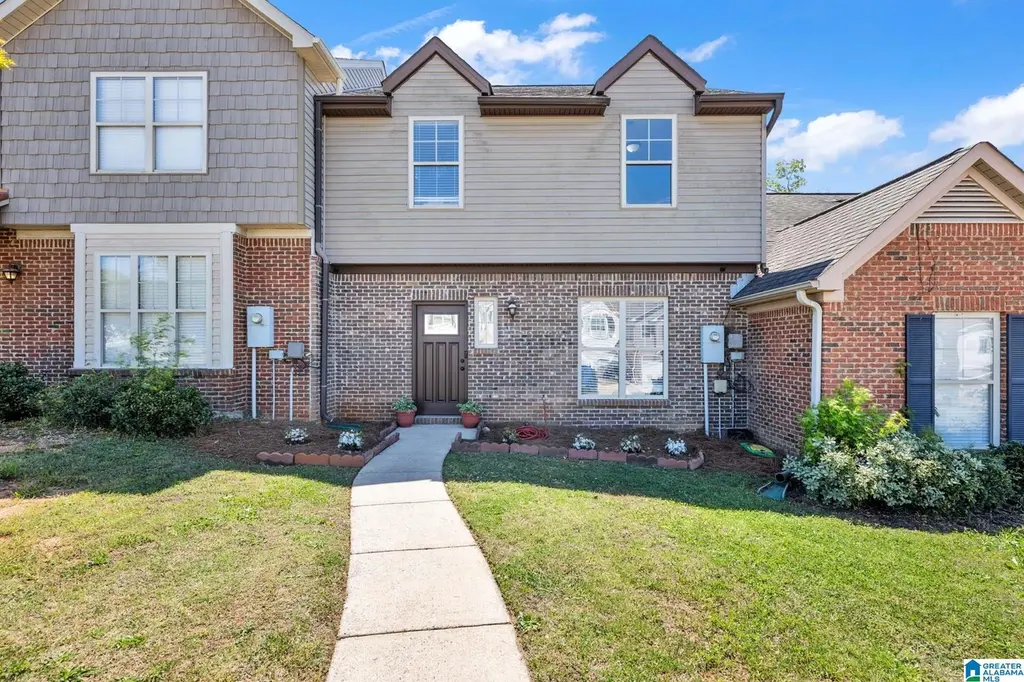
113 The Heights Dr
Calera, AL 35040
$185,000D+
3 bd · 3.0 ba ·
1,344 sqft ·
Built 2010
· Townhouse
· Pending
· 26 DOM
Cashflow @ list (25.0% down · 7.5%)
Estimated rent
$1,714/mo
Mortgage (P&I)
−$970
Tax + insurance
−$239
HOA
−$25
Vac / Maint / Mgmt
−$360
Net cashflow
$121/mo
Annual
$1,448/yr
Cap rate
7.08%
Cash-on-cash
2.80%
DSCR
1.12
1% rule
0.93%
Cash to close
$51,800
Investor read
- This is a 3-bed/3.0-bath townhouse listed at $185k.
- At list price, monthly cash flow is $121 ($1k/yr) — positive.
- The deal already cash-flows at list — no discount required.
- To meet the 1% rule (rent ≥ 1% of price), the offer needs to be $171k (7.3% below list).
- It's been on market 26 days — a 2% lower offer ($182k) is reasonable based on typical stale-listing flexibility.
- Recommended offer: $171k (7.3% below list) — sets the bar for 1% rule.
- Local home prices are declining (-3.0%/yr); year-one equity from $1k of loan paydown is wiped out by about $6k of value loss. Plan a longer hold.
- Location reads 59/100 on livability (#325 in AL) — a working-class tenant base; expect higher turnover. Strengths: cost of living A+, housing A+, employment A-; Watch: schools D+, amenities F, commute F.
- Shelby County (suburban): math 30% / reading 58% proficiency, ranked #16 of 129 in AL (top 12%) — families likely to look elsewhere, expect single-tenant / working-renter base with shorter leases.
- Market conditions: Rents rising (+3.7%/yr); 374 active listings in the ZIP; 13 comparable units currently listed for rent nearby; rentals leasing fast (median 11d on market — plan ~1-2 weeks tenant-placement turnaround); solid renter incomes; 987 units permitted in Shelby County in 2024 (0 in 5+ unit buildings).
- Shelby County population projected at +23% by 2050 — long-run rental-demand tailwind backs the buy-and-hold thesis.
- 2 sale attempts since 7y ago with the ask held roughly flat each time — persistent listings suggest the price (not the market) is what's stuck; bring a comps-based counter.
- Current owner paid $122k; list at $185k implies a 52% gain — meaningful room to come down on a strong offer.
- Climate carrying-cost: major wind risk, 46% chance of damaging wind over 30y; extreme-heat days projected 7→20/yr by 2055 (HVAC capex compounding) — expect insurance premiums to compound above CPI over the hold.
- Cap rate 7.1% vs local median 4.5% in Calera — top-decile yield for the area; either an underpriced asset or a hidden risk that comps aren't pricing in. Stress-test before assuming the spread holds.
Questions for listing agent
- What does the HOA fee cover, when was the last increase, and are there any pending special assessments or reserve-fund shortfalls?
- Is there a deadline driving the sale (1031 exchange, divorce, estate, relocation)? That informs how much negotiation room exists.
- Schools are D-rated, which usually means shorter tenancies and higher turnover. Who's the typical renter profile here, and what's been the actual vacancy rate?
- The area grade is low — what's the realistic commute time and amenity access for the typical tenant pool here? Any planned neighborhood developments (good or bad) we should know about?
- What's the average days-on-market for RENTAL listings here right now (not sales)? A rising rental-DOM trend means longer vacancies and softer asking-rent achievability than the comps imply.
- What's the recent tenant-quality profile in this submarket — average credit score on applications, eviction rate, late-payment / NSF rate, and stable-employment percentage? A property-management company in the area should have these aggregated.
- How much new for-sale + rental construction is in the pipeline within 1–3 miles? Heavy new supply typically softens prices + rents 12–24 months out; constrained supply supports both.
CashFlowRE · CFR-T2HT7F3MED4FQM
· Data 3 weeks ago
cashflowre.app · 2026-05-29