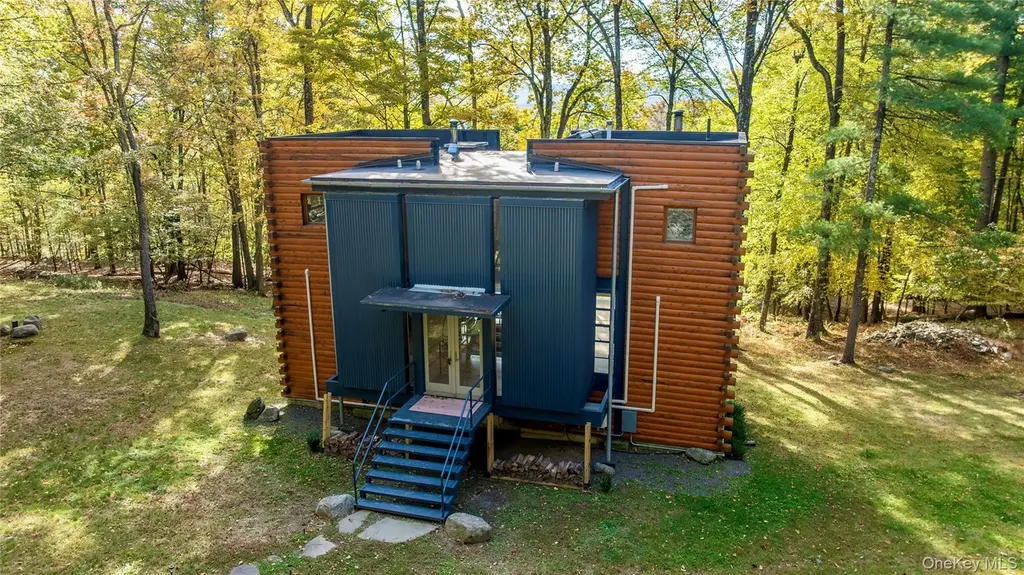
39 Hornbeck Ln
Stone Ridge, NY 12404
$995,000F
2 bd · 2.0 ba ·
1,505 sqft ·
Built 1994
· SingleFamily
· Active
· 243 DOM
Cashflow @ list (25.0% down · 7.5%)
Estimated rent
$3,425/mo
Mortgage (P&I)
−$5,218
Tax + insurance
−$1,829
HOA
−$0
Vac / Maint / Mgmt
−$719
Net cashflow
$-4,341/mo
Annual
$-52,090/yr
Cap rate
1.06%
Cash-on-cash
-18.70%
DSCR
0.17
1% rule
0.34%
Cash to close
$278,600
Investor read
- This is a 2-bed/2.0-bath single-family listed at $995k.
- At list price, monthly cash flow is $-4k ($-52k/yr) — negative.
- To cash-flow at today's rent, offer at most $339k (65.9% below list).
- To meet the 1% rule (rent ≥ 1% of price), the offer needs to be $343k (65.6% below list).
- It's been on market 243 days — a 12% lower offer ($876k) is reasonable based on typical stale-listing flexibility.
- Recommended offer: $339k (65.9% below list) — sets the bar for cash-flow.
- Local home prices are declining (-3.0%/yr); year-one equity from $7k of loan paydown is wiped out by about $30k of value loss. Plan a longer hold.
- Location reads 59/100 on livability (#1,034 in NY) — a working-class tenant base; expect higher turnover. Strengths: crime A+, housing A-; Watch: employment C-, amenities F, commute F.
- Rondout Valley Central School District (rural): math 39% / reading 51% proficiency, ranked #447 of 590 in NY (top 76%) — families likely to look elsewhere, expect single-tenant / working-renter base with shorter leases.
- Zoned schools: Marbletown Elementary School (math 52% / reading 64%, grade B-, #831 of 2,108 statewide, top 39%, 257 students, 36% FRL); Rondout Valley Junior High School (math 27% / reading 42%, grade F, #483 of 729 statewide, top 68%, 243 students, 42% FRL); Rondout Valley High School (math 87% / reading 64%, grade A-, #623 of 1,100 statewide, top 57%, 569 students, 41% FRL).
- Market conditions: 41 active listings in the ZIP; 464 units permitted in Ulster County in 2024 (170 in 5+ unit buildings).
- Ulster County population projected at -14% by 2050 — secular population decline; favor cash flow + early exit over multi-decade hold.
- 13 sale attempts since 8y ago with the ask held roughly flat each time — persistent listings suggest the price (not the market) is what's stuck; bring a comps-based counter.
- Cap rate 1.1% vs local median 2.1% in Stone Ridge — below-typical yield; the buyer is paying a premium for something (appreciation thesis, condition, location) that the cap rate doesn't capture.
Questions for listing agent
- What do current leases actually rent for vs. the listed asking? Can we see a recent rent roll and the last 12 months of T-12 income?
- It's been on market 243 days. Have you received any prior offers? Is the seller open to a 66% concession, seller financing, or rate buy-down credit?
- Why hasn't it sold? Are there any deal-killer items the seller is aware of (foundation, flood, title, zoning, code violations)?
- Is there a deadline driving the sale (1031 exchange, divorce, estate, relocation)? That informs how much negotiation room exists.
- Schools are B-rated — typically a magnet for longer-tenancy family renters. What's the average tenant stay here, and is there a school-zone premium baked into asking?
- The area grade is low — what's the realistic commute time and amenity access for the typical tenant pool here? Any planned neighborhood developments (good or bad) we should know about?
- What's the average days-on-market for RENTAL listings here right now (not sales)? A rising rental-DOM trend means longer vacancies and softer asking-rent achievability than the comps imply.
- What's the recent tenant-quality profile in this submarket — average credit score on applications, eviction rate, late-payment / NSF rate, and stable-employment percentage? A property-management company in the area should have these aggregated.
CashFlowRE · CFR-T3S7T8C47ZTZ6T
· Data 16 h ago
cashflowre.app · 2026-05-29