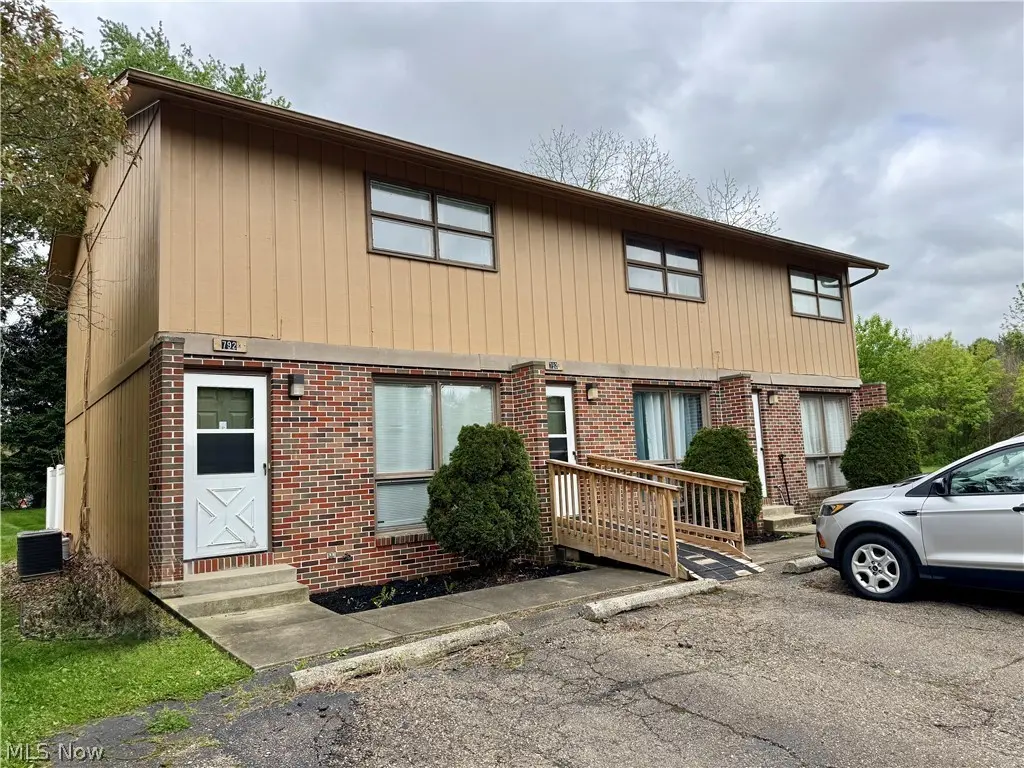
792 Kingwood Dr NE
Wilkshire Hills, OH 44612
$289,900C-
6 bd · 3.0 ba ·
3,072 sqft ·
Built 1972
· MultiFamily
· Pending
· 14 DOM
Cashflow @ list (25.0% down · 7.5%)
Estimated rent
$2,705/mo
Mortgage (P&I)
−$1,520
Tax + insurance
−$419
HOA
−$0
Vac / Maint / Mgmt
−$568
Net cashflow
$197/mo
Annual
$2,366/yr
Cap rate
7.11%
Cash-on-cash
2.92%
DSCR
1.13
1% rule
0.93%
Cash to close
$81,172
Investor read
- This is a 2 × 3-bed/?-bath units multifamily listed at $290k.
- At list price, monthly cash flow is $197 ($2k/yr) — positive. Per door: $99/mo.
- The deal already cash-flows at list — no discount required.
- To meet the 1% rule (rent ≥ 1% of price), the offer needs to be $270k (6.7% below list).
- Only 14 days on market — expect competitive offers; lowballing is unlikely to land.
- Recommended offer: $270k (6.7% below list) — sets the bar for 1% rule.
- Local home prices are declining (-3.0%/yr); year-one equity from $2k of loan paydown is wiped out by about $9k of value loss. Plan a longer hold.
- Location reads: area grade C — affects rentability + tenant quality, not the cash-flow math above.
- Tuscarawas Valley Local (rural): math 71% / reading 71% proficiency, ranked #138 of 656 in OH (top 21%) — strong family-tenant draw, lease renewals of 3-5y typical.
- Zoned schools: Tuscarawas Valley Intermediate (math 72% / reading 67%, grade A-, #391 of 1,584 statewide, top 27%, 287 students, 36% FRL); Tuscarawas Valley Middle School (math 72% / reading 73%, grade A, #113 of 654 statewide, top 17%, 407 students, 32% FRL); Tuscarawas Valley High School (math 62% / reading 77%, grade B, #106 of 781 statewide, top 16%, 331 students, 31% FRL) — zoned schools at 33% FRL track the district average.
- Market conditions: 26 active listings in the ZIP; solid renter incomes; 244 units permitted in Tuscarawas County in 2024 (0 in 5+ unit buildings).
- Tuscarawas County population projected to shrink 10% by 2050 — rents likely to lag national; underwrite the cash flow, not the appreciation.
- 5 sale attempts since 11y ago with the ask held roughly flat each time — persistent listings suggest the price (not the market) is what's stuck; bring a comps-based counter.
- Current owner paid $210k; 38% above their basis — modest negotiation headroom, anchor on the comps not their cost.
- This rent runs 38% of the median local income ($85k/yr) — at the standard rent-burdened threshold; future hikes will face affordability resistance.
Questions for listing agent
- Can we see the unit-by-unit rent roll, current vacancy, and any below-market leases? What's the average tenancy length?
- What capital expenditures (roof, boiler, parking lot, exteriors) have been made in the last 5 years, and what's planned in the next 2?
- Built in 1972 — when were the roof, HVAC, electrical panel, plumbing, and water heater last replaced?
- Is there a deadline driving the sale (1031 exchange, divorce, estate, relocation)? That informs how much negotiation room exists.
- What's the average days-on-market for RENTAL listings here right now (not sales)? A rising rental-DOM trend means longer vacancies and softer asking-rent achievability than the comps imply.
- What's the recent tenant-quality profile in this submarket — average credit score on applications, eviction rate, late-payment / NSF rate, and stable-employment percentage? A property-management company in the area should have these aggregated.
- How much new apartment / multifamily construction is in the pipeline within 1–3 miles? Heavy new supply (>2% of stock underway) typically softens rents 12–24 months out; light construction supports rent growth.
CashFlowRE · CFR-T6TVAG7Y1V803T
· Data 2 weeks ago
cashflowre.app · 2026-05-29