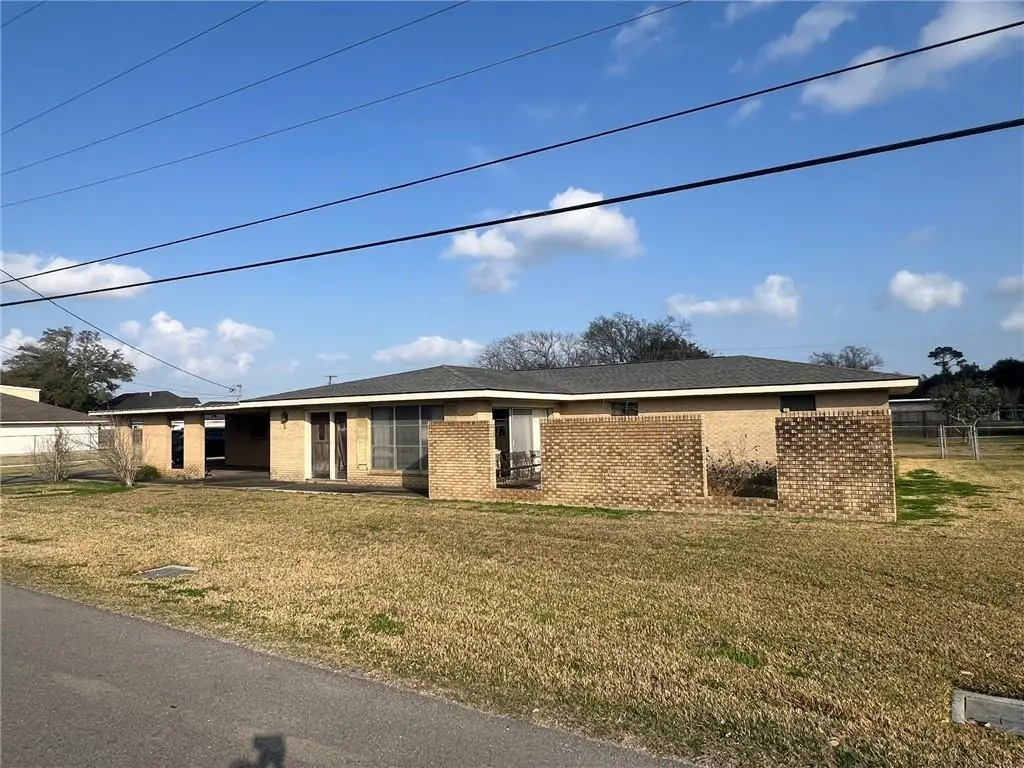
125 River Oaks Dr
Luling, LA 70070
$249,000C
4 bd · 3.0 ba ·
2,950 sqft ·
Built 1961
· SingleFamily
· Active
· 99 DOM
Cashflow @ list (25.0% down · 7.5%)
Estimated rent
$2,224/mo
Mortgage (P&I)
−$1,306
Tax + insurance
−$236
HOA
−$0
Vac / Maint / Mgmt
−$467
Net cashflow
$215/mo
Annual
$2,585/yr
Cap rate
7.65%
Cash-on-cash
4.85%
DSCR
1.22
1% rule
0.89%
Cash to close
$69,720
Investor read
- This is a 4-bed/3.0-bath single-family listed at $249k.
- At list price, monthly cash flow is $215 ($3k/yr) — positive.
- The deal already cash-flows at list — no discount required.
- To meet the 1% rule (rent ≥ 1% of price), the offer needs to be $222k (10.7% below list).
- It's been on market 99 days — a 9% lower offer ($227k) is reasonable based on typical stale-listing flexibility.
- Recommended offer: $222k (10.7% below list) — sets the bar for 1% rule.
- Local home prices are declining (-3.0%/yr); year-one equity from $2k of loan paydown is wiped out by about $7k of value loss. Plan a longer hold.
- Location reads 65/100 on livability (#144 in LA) — a middle-class / working-renter tenant base. Strengths: housing A+, employment A, cost of living A; Watch: amenities F, commute F, health & safety F.
- St. Charles Parish (suburban): math 40% / reading 51% proficiency, ranked #14 of 98 in LA (top 14%) — families likely to look elsewhere, expect single-tenant / working-renter base with shorter leases.
- Watch-outs: flood insurance adds $66/mo.
- Market conditions: 151 active listings in the ZIP; solid renter incomes; 74 units permitted in St. Charles Parish in 2024 (0 in 5+ unit buildings).
- St. Charles County population projected to shrink 7% by 2050 — rents likely to lag national; underwrite the cash flow, not the appreciation.
- 2 sale attempts; this cycle's ask has dropped $46k (16%) from the opening price — seller is motivated, your offer sets the floor, not the list.
- Climate carrying-cost: severe flood risk; severe wind risk, 99% chance of damaging wind over 30y; extreme-heat days projected 7→22/yr by 2055 (HVAC capex compounding) — expect insurance premiums to compound above CPI over the hold.
- Cap rate 7.7% vs local median 4.0% in Luling — top-decile yield for the area; either an underpriced asset or a hidden risk that comps aren't pricing in. Stress-test before assuming the spread holds.
- This rent runs 35% of the median local income ($77k/yr) — at the standard rent-burdened threshold; future hikes will face affordability resistance.
Questions for listing agent
- It's been on market 99 days. Have you received any prior offers? Is the seller open to a 11% concession, seller financing, or rate buy-down credit?
- Built in 1961 — when were the roof, HVAC, electrical panel, plumbing, and water heater last replaced?
- What's the actual annual flood-insurance premium (NFIP or private), and is the property in a SFHA with mandatory coverage?
- Why hasn't it sold? Are there any deal-killer items the seller is aware of (foundation, flood, title, zoning, code violations)?
- Is there a deadline driving the sale (1031 exchange, divorce, estate, relocation)? That informs how much negotiation room exists.
- Schools are B-rated — typically a magnet for longer-tenancy family renters. What's the average tenant stay here, and is there a school-zone premium baked into asking?
- What's the average days-on-market for RENTAL listings here right now (not sales)? A rising rental-DOM trend means longer vacancies and softer asking-rent achievability than the comps imply.
- What's the recent tenant-quality profile in this submarket — average credit score on applications, eviction rate, late-payment / NSF rate, and stable-employment percentage? A property-management company in the area should have these aggregated.
CashFlowRE · CFR-T70EW62058VDTK
· Data 2 days ago
cashflowre.app · 2026-05-29