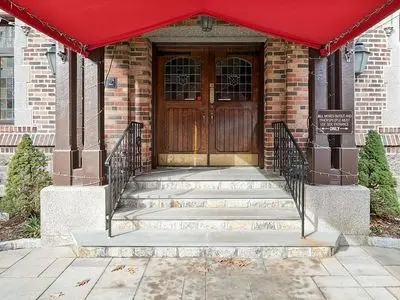
143 Garth Rd
Eastchester, NY 10583
$315,000C-
1 bd · 1.0 ba ·
— sqft ·
Built 1929
· MultiFamily
· Under Contract
Cashflow @ list (25.0% down · 7.5%)
Estimated rent
$3,178/mo
Mortgage (P&I)
−$1,652
Tax + insurance
−$525
HOA
−$0
Vac / Maint / Mgmt
−$667
Net cashflow
$334/mo
Annual
$4,008/yr
Cap rate
7.57%
Cash-on-cash
4.54%
DSCR
1.20
1% rule
1.01%
Cash to close
$88,200
Investor read
- This is a 1-bed/1.0-bath multifamily listed at $315k.
- At list price, monthly cash flow is $334 ($4k/yr) — positive.
- The deal already cash-flows at list — no discount required.
- Meets the 1% rule at list price ($3k rent vs $315k).
- Only 0 days on market — expect competitive offers; lowballing is unlikely to land.
- Local home prices are declining (-3.0%/yr); year-one equity from $2k of loan paydown is wiped out by about $9k of value loss. Plan a longer hold.
- Location reads 78/100 on livability (#159 in NY, #2,451 nationally) — a middle-class / working-renter tenant base. Strengths: schools A+, crime A+, commute A+; Watch: amenities D-, cost of living F, health & safety D-.
- Eastchester Union Free School District (suburban): math 79% / reading 80% proficiency, ranked #42 of 590 in NY (top 7%) — strong family-tenant draw, lease renewals of 3-5y typical; only 2% free/reduced lunch — higher-income household profile.
- Watch-outs: built in 1929 — expect roof / HVAC / electrical / plumbing capex.
- Market conditions: 292 active listings in the ZIP; 16 comparable units currently listed for rent nearby; rentals at typical pace (median 25d on market — plan ~3-4 weeks tenant-placement turnaround); 44% of comp listings sitting > 30 days — soft ceiling on asking rent; high-income renter base; 954 units permitted in Westchester County in 2024 (649 in 5+ unit buildings).
- Westchester County population projected at +10% by 2050 — modest demand growth; plan on rents tracking national, not racing it.
- Climate carrying-cost: major wind risk, 27% chance of damaging wind over 30y; extreme-heat days projected 7→15/yr by 2055 (HVAC capex compounding) — expect insurance premiums to compound above CPI over the hold.
- Cap rate 7.6% vs local median 4.2% in Eastchester — top-decile yield for the area; either an underpriced asset or a hidden risk that comps aren't pricing in. Stress-test before assuming the spread holds.
- This rent is only 15% of the median local income ($250k/yr) — well below the 30% rent-burden line; pricing power to push rent on renewal without tenant pushback.
Questions for listing agent
- Built in 1929 — when were the roof, HVAC, electrical panel, plumbing, and water heater last replaced?
- Is there a deadline driving the sale (1031 exchange, divorce, estate, relocation)? That informs how much negotiation room exists.
- Schools are A-rated — typically a magnet for longer-tenancy family renters. What's the average tenant stay here, and is there a school-zone premium baked into asking?
- What's the average days-on-market for RENTAL listings here right now (not sales)? A rising rental-DOM trend means longer vacancies and softer asking-rent achievability than the comps imply.
- What's the recent tenant-quality profile in this submarket — average credit score on applications, eviction rate, late-payment / NSF rate, and stable-employment percentage? A property-management company in the area should have these aggregated.
- How much new apartment / multifamily construction is in the pipeline within 1–3 miles? Heavy new supply (>2% of stock underway) typically softens rents 12–24 months out; light construction supports rent growth.
CashFlowRE · CFR-T78XHSBHMHBCR6
· Data 1 week ago
cashflowre.app · 2026-05-29