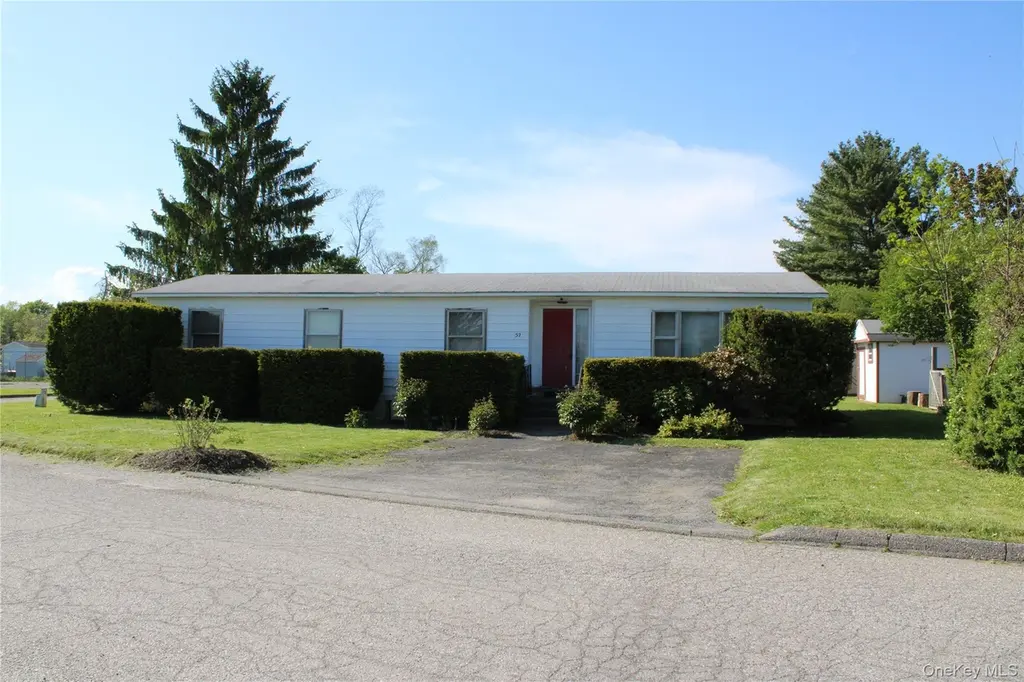
160 Holesapple Rd #52
Dover Plains, NY 12522
$99,999C-
3 bd · 2.0 ba ·
1,200 sqft ·
Built 1973
· Manufactured
· Active
· 34 DOM
Cashflow @ list (25.0% down · 7.5%)
Estimated rent
$4,400/mo
Mortgage (P&I)
−$524
Tax + insurance
−$167
HOA
−$510
Vac / Maint / Mgmt
−$924
Net cashflow
$2,275/mo
Annual
$27,295/yr
Cap rate
33.59%
Cash-on-cash
97.48%
DSCR
5.34
1% rule
4.40%
Cash to close
$28,000
Investor read
- This is a 3-bed/2.0-bath manufactured listed at $100k. Condition is rated fair.
- At list price, monthly cash flow is $2k ($27k/yr) — positive.
- The deal already cash-flows at list — no discount required.
- Meets the 1% rule at list price ($4k rent vs $100k).
- It's been on market 34 days — a 3% lower offer ($97k) is reasonable based on typical stale-listing flexibility.
- Recommended offer: $97k (3.0% below list) — sets the bar for market timing.
- In year one you build about $11k of equity ($691 loan paydown + $10k appreciation (10.0% local appreciation)).
- Location reads 63/100 on livability (#818 in NY) — a middle-class / working-renter tenant base. Strengths: crime A, cost of living B; Watch: commute C-, housing D+, amenities F.
- Dover Union Free School District (rural): math 44% / reading 48% proficiency, ranked #433 of 590 in NY (top 73%) — families likely to look elsewhere, expect single-tenant / working-renter base with shorter leases.
- Zoned schools: Dover Elementary School (math 33% / reading 44%, grade F, #1,509 of 2,108 statewide, top 72%, 296 students, 71% FRL); Dover Middle School (math 32% / reading 47%, grade F, #418 of 729 statewide, top 59%, 301 students, 68% FRL); Dover High School (math 92% / reading 74%, grade A, #435 of 1,100 statewide, top 40%, 467 students, 59% FRL) — zoned schools average 66% FRL vs 38% district-wide (29 pts higher); higher-poverty schools than district average — tighter screening recommended.
- Market conditions: 38 active listings in the ZIP; 620 units permitted in Dutchess County in 2024 (242 in 5+ unit buildings).
- Dutchess County population projected at -11% by 2050 — secular population decline; favor cash flow + early exit over multi-decade hold.
- 8 sale attempts since 2y ago with the ask held roughly flat each time — persistent listings suggest the price (not the market) is what's stuck; bring a comps-based counter.
- At projected returns (10.0% appreciation + 3.0% rent growth), your $28k cash investment doubles in ~1 year — after that, you're playing with house money.
- By year 4, paydown + projected appreciation supports a ~$38k cash-out refi (75% LTV) — recoverable capital for the next deal without selling this one.
Questions for listing agent
- It's been on market 34 days. Have you received any prior offers? Is the seller open to a 3% concession, seller financing, or rate buy-down credit?
- Have any recent inspections been done? Can we get a copy of the seller's disclosures and any deferred-maintenance estimates?
- Built in 1973 — when were the roof, HVAC, electrical panel, plumbing, and water heater last replaced?
- What does the HOA fee cover, when was the last increase, and are there any pending special assessments or reserve-fund shortfalls?
- Is there a deadline driving the sale (1031 exchange, divorce, estate, relocation)? That informs how much negotiation room exists.
- What's the average days-on-market for RENTAL listings here right now (not sales)? A rising rental-DOM trend means longer vacancies and softer asking-rent achievability than the comps imply.
- What's the recent tenant-quality profile in this submarket — average credit score on applications, eviction rate, late-payment / NSF rate, and stable-employment percentage? A property-management company in the area should have these aggregated.
- How much new for-sale + rental construction is in the pipeline within 1–3 miles? Heavy new supply typically softens prices + rents 12–24 months out; constrained supply supports both.
Repairs flagged (vision-AI assessment)
- Minor: exterior siding — Some discoloration
- Minor: interior paint — Some wear
CashFlowRE · CFR-T8DWFYAT9WQA5B
· Data 14 h ago
cashflowre.app · 2026-05-29