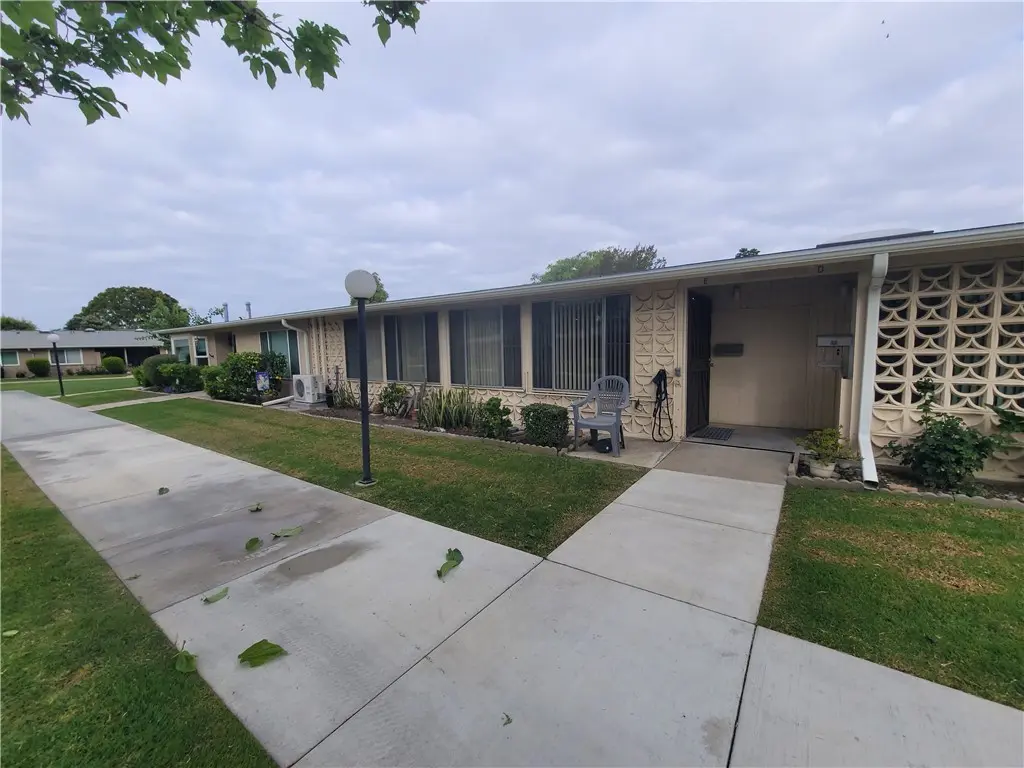
13561 Medinac M5-70E Ln
Seal Beach, CA 90740
$294,900C-
2 bd · 1.0 ba ·
833 sqft ·
Built 1962
· Condo
· Active
· 36 DOM
Cashflow @ list (25.0% down · 7.5%)
Estimated rent
$3,285/mo
Mortgage (P&I)
−$1,546
Tax + insurance
−$558
HOA
−$580
Vac / Maint / Mgmt
−$690
Net cashflow
$-89/mo
Annual
$-1,073/yr
Cap rate
6.20%
Cash-on-cash
-0.33%
DSCR
0.99
1% rule
1.11%
Cash to close
$82,572
Investor read
- This is a 2-bed/1.0-bath condo listed at $295k.
- At list price, monthly cash flow is $-89 ($-1k/yr) — negative.
- To cash-flow at today's rent, offer at most $282k (4.4% below list).
- Meets the 1% rule at list price ($3k rent vs $295k).
- It's been on market 36 days — a 3% lower offer ($286k) is reasonable based on typical stale-listing flexibility.
- Recommended offer: $282k (4.4% below list) — sets the bar for cash-flow.
- Local home prices are declining (-3.0%/yr); year-one equity from $2k of loan paydown is wiped out by about $9k of value loss. Plan a longer hold.
- Location reads 58/100 on livability (#695 in CA) — a working-class tenant base; expect higher turnover. Strengths: employment A+, schools A, housing A-; Watch: health & safety D, crime F, amenities F.
- Los Alamitos Unified (suburban): math 57% / reading 82% proficiency, ranked #52 of 517 in CA (top 10%) — acceptable for families but not a draw, mixed tenant base, ~2y average lease; only 10% free/reduced lunch — higher-income household profile.
- Watch-outs: flood insurance adds $66/mo.
- Market conditions: Rents rising fast (+4.8%/yr); 110 active listings in the ZIP; 3 comparable units currently listed for rent nearby; rentals at typical pace (median 25d on market — plan ~3-4 weeks tenant-placement turnaround); solid renter incomes; 6,974 units permitted in Orange County in 2024 (3,839 in 5+ unit buildings).
- Orange County population projected at +14% by 2050 — modest demand growth; plan on rents tracking national, not racing it.
- 7 sale attempts since 12y ago; this cycle's ask has dropped $55k (16%) from the opening price — seller is motivated, your offer sets the floor, not the list.
- Climate carrying-cost: severe flood risk; extreme-heat days projected 7→23/yr by 2055 (HVAC capex compounding) — expect insurance premiums to compound above CPI over the hold.
- Cap rate 6.2% vs local median 3.3% in Seal Beach — top-decile yield for the area; either an underpriced asset or a hidden risk that comps aren't pricing in. Stress-test before assuming the spread holds.
- At $3,285/mo this rent would consume 46% of the median local household income ($85k/yr) (locally 730% of renters already pay >50% of income on rent) — very limited rent-growth headroom before tenants either downsize or default.
Questions for listing agent
- What do current leases actually rent for vs. the listed asking? Can we see a recent rent roll and the last 12 months of T-12 income?
- It's been on market 36 days. Have you received any prior offers? Is the seller open to a 4% concession, seller financing, or rate buy-down credit?
- Built in 1962 — when were the roof, HVAC, electrical panel, plumbing, and water heater last replaced?
- What's the actual annual flood-insurance premium (NFIP or private), and is the property in a SFHA with mandatory coverage?
- What does the HOA fee cover, when was the last increase, and are there any pending special assessments or reserve-fund shortfalls?
- Any open or pending special assessments — roof, HVAC, plumbing, elevator, façade? What's the per-unit balance and payoff schedule, and is the seller paying it off at close or rolling it to the buyer?
- Is there a deadline driving the sale (1031 exchange, divorce, estate, relocation)? That informs how much negotiation room exists.
- Schools are A-rated — typically a magnet for longer-tenancy family renters. What's the average tenant stay here, and is there a school-zone premium baked into asking?
CashFlowRE · CFR-T8JWN5A8XCF589
· Data 2 days ago
cashflowre.app · 2026-05-29