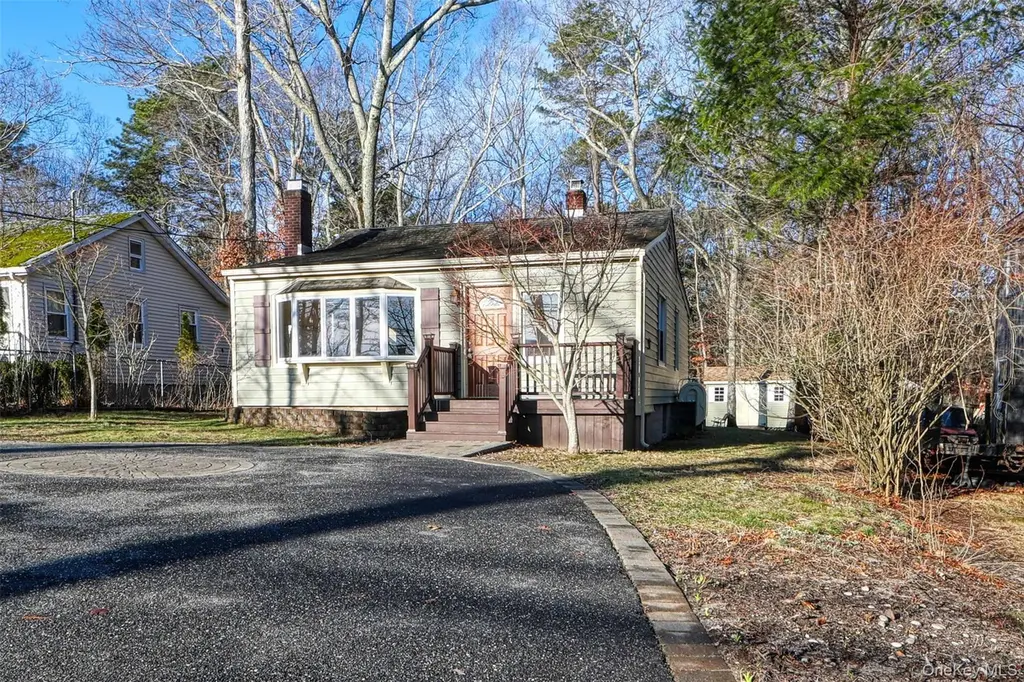
180 Lakeside Trl
Ridge, NY 11961
$495,000B-
3 bd · 1.0 ba ·
996 sqft ·
Built 1950
· SingleFamily
· Pending
· 27 DOM
Cashflow @ list (25.0% down · 7.5%)
Estimated rent
$10,813/mo
Mortgage (P&I)
−$2,596
Tax + insurance
−$682
HOA
−$17
Vac / Maint / Mgmt
−$2,271
Net cashflow
$5,247/mo
Annual
$62,963/yr
Cap rate
19.01%
Cash-on-cash
45.43%
DSCR
3.02
1% rule
2.18%
Cash to close
$138,600
Investor read
- This is a 3-bed/1.0-bath single-family listed at $495k.
- At list price, monthly cash flow is $5k ($63k/yr) — positive.
- The deal already cash-flows at list — no discount required.
- Meets the 1% rule at list price ($11k rent vs $495k).
- It's been on market 27 days — a 2% lower offer ($488k) is reasonable based on typical stale-listing flexibility.
- Recommended offer: $488k (1.5% below list) — sets the bar for market timing.
- Local home prices are declining (-3.0%/yr); year-one equity from $3k of loan paydown is wiped out by about $15k of value loss. Plan a longer hold.
- Location reads 61/100 on livability (#932 in NY) — a middle-class / working-renter tenant base. Strengths: employment A+, housing A+; Watch: amenities F, commute F, cost of living F.
- Longwood Central School District (rural): math 61% / reading 55% proficiency, ranked #235 of 590 in NY (top 40%) — acceptable for families but not a draw, mixed tenant base, ~2y average lease.
- Zoned schools: Ridge Elementary School (math 42% / reading 57%, grade D, #1,085 of 2,108 statewide, top 56%, 719 students, 44% FRL); Longwood Junior High School (math 67% / reading 67%, grade A-, #101 of 729 statewide, top 15%, 1,388 students, 48% FRL); Longwood High School (math 90% / reading 77%, grade A, #409 of 1,100 statewide, top 39%, 2,977 students, 44% FRL).
- Watch-outs: built in 1950 — expect roof / HVAC / electrical / plumbing capex.
- Market conditions: 136 active listings in the ZIP; 1 comparable units currently listed for rent nearby; 1,366 units permitted in Suffolk County in 2024 (216 in 5+ unit buildings).
- Suffolk County population projected to shrink 5% by 2050 — rents likely to lag national; underwrite the cash flow, not the appreciation.
- 2 sale attempts with the ask held roughly flat each time — persistent listings suggest the price (not the market) is what's stuck; bring a comps-based counter.
- Current owner paid $425k; 16% above their basis — modest negotiation headroom, anchor on the comps not their cost.
- At projected returns (-3.0% appreciation + 3.0% rent growth), your $139k cash investment doubles in ~3 years — after that, you're playing with house money.
- Cap rate 19.0% vs local median 3.0% in Ridge — top-decile yield for the area; either an underpriced asset or a hidden risk that comps aren't pricing in. Stress-test before assuming the spread holds.
Questions for listing agent
- Built in 1950 — when were the roof, HVAC, electrical panel, plumbing, and water heater last replaced?
- What does the HOA fee cover, when was the last increase, and are there any pending special assessments or reserve-fund shortfalls?
- Is there a deadline driving the sale (1031 exchange, divorce, estate, relocation)? That informs how much negotiation room exists.
- What's the average days-on-market for RENTAL listings here right now (not sales)? A rising rental-DOM trend means longer vacancies and softer asking-rent achievability than the comps imply.
- What's the recent tenant-quality profile in this submarket — average credit score on applications, eviction rate, late-payment / NSF rate, and stable-employment percentage? A property-management company in the area should have these aggregated.
- How much new for-sale + rental construction is in the pipeline within 1–3 miles? Heavy new supply typically softens prices + rents 12–24 months out; constrained supply supports both.
CashFlowRE · CFR-T9NCYX8YJ5KCSV
· Data 4 weeks ago
cashflowre.app · 2026-05-29