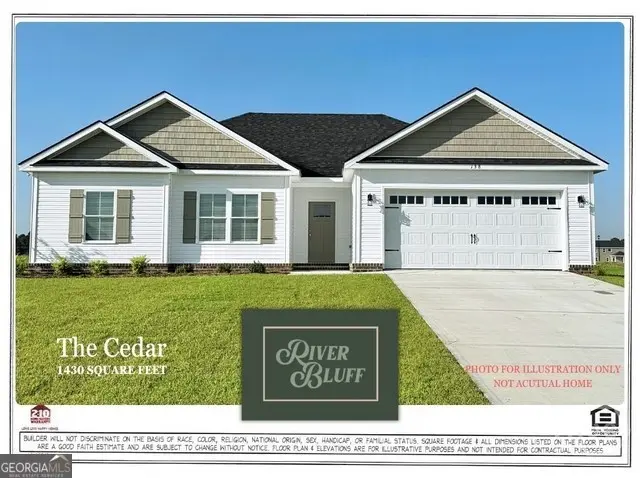
676 Belfast Loop
Guyton, GA 31308
$304,900D-
3 bd · 2.0 ba ·
1,430 sqft ·
Built 2026
· SingleFamily
· Pending
· 21 DOM
Cashflow @ list (25.0% down · 7.5%)
Estimated rent
$2,450/mo
Mortgage (P&I)
−$1,599
Tax + insurance
−$508
HOA
−$15
Vac / Maint / Mgmt
−$514
Net cashflow
$-187/mo
Annual
$-2,239/yr
Cap rate
5.56%
Cash-on-cash
-2.62%
DSCR
0.88
1% rule
0.80%
Cash to close
$85,372
Investor read
- This is a 3-bed/2.0-bath single-family listed at $305k. Condition is rated poor.
- At list price, monthly cash flow is $-187 ($-2k/yr) — negative.
- To cash-flow at today's rent, offer at most $278k (8.9% below list).
- To meet the 1% rule (rent ≥ 1% of price), the offer needs to be $245k (19.6% below list).
- It's been on market 21 days — a 2% lower offer ($300k) is reasonable based on typical stale-listing flexibility.
- Recommended offer: $245k (19.6% below list) — sets the bar for 1% rule.
- Local home prices are declining (-3.0%/yr); year-one equity from $2k of loan paydown is wiped out by about $9k of value loss. Plan a longer hold.
- Location reads 69/100 on livability (#128 in GA) — a middle-class / working-renter tenant base. Strengths: crime A+, cost of living A+, housing A+; Watch: schools C-, amenities F, commute F.
- Bulloch County (rural): math 32% / reading 33% proficiency, ranked #85 of 174 in GA (top 49%) — families likely to look elsewhere, expect single-tenant / working-renter base with shorter leases.
- Market conditions: 79 active listings in the ZIP; 1 comparable units currently listed for rent nearby; 668 units permitted in Bulloch County in 2024 (6 in 5+ unit buildings).
- Bulloch County population projected at +18% by 2050 — long-run rental-demand tailwind backs the buy-and-hold thesis.
- 2 sale attempts with the ask held roughly flat each time — persistent listings suggest the price (not the market) is what's stuck; bring a comps-based counter.
- Climate carrying-cost: severe wind risk, 99% chance of damaging wind over 30y; major wildfire risk; extreme-heat days projected 7→18/yr by 2055 (HVAC capex compounding) — expect insurance premiums to compound above CPI over the hold.
- Cap rate 5.6% vs local median 4.5% in Guyton — meaningfully above typical; check what's discounted (condition, days-on-market, listing class) to confirm the premium yield is real.
Questions for listing agent
- What do current leases actually rent for vs. the listed asking? Can we see a recent rent roll and the last 12 months of T-12 income?
- Have any recent inspections been done? Can we get a copy of the seller's disclosures and any deferred-maintenance estimates?
- What does the HOA fee cover, when was the last increase, and are there any pending special assessments or reserve-fund shortfalls?
- Is there a deadline driving the sale (1031 exchange, divorce, estate, relocation)? That informs how much negotiation room exists.
- The area grade is low — what's the realistic commute time and amenity access for the typical tenant pool here? Any planned neighborhood developments (good or bad) we should know about?
- What's the average days-on-market for RENTAL listings here right now (not sales)? A rising rental-DOM trend means longer vacancies and softer asking-rent achievability than the comps imply.
- What's the recent tenant-quality profile in this submarket — average credit score on applications, eviction rate, late-payment / NSF rate, and stable-employment percentage? A property-management company in the area should have these aggregated.
- How much new for-sale + rental construction is in the pipeline within 1–3 miles? Heavy new supply typically softens prices + rents 12–24 months out; constrained supply supports both.
Repairs flagged (vision-AI assessment)
- Major: siding — Severe weathering
- Major: roof — Shingles appear aged
- Major: exterior paint — Visible wear
CashFlowRE · CFR-TAVMTZ3TFSA4NH
· Data 3 weeks ago
cashflowre.app · 2026-05-29