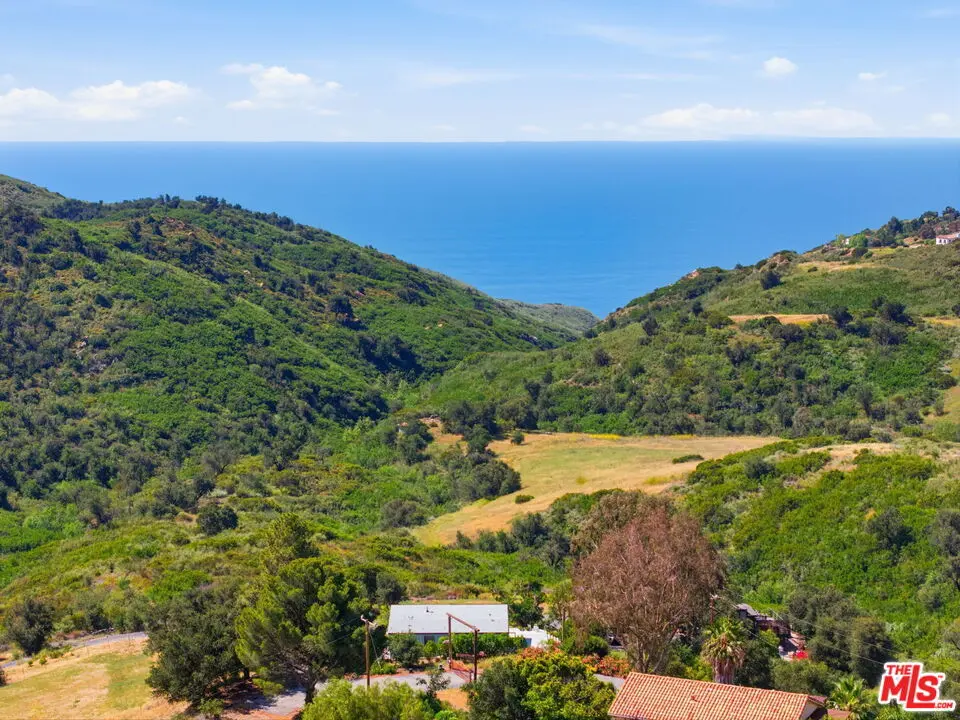
3065 S S Foose Rd
Malibu, CA 90265
$1,875,000C
4 bd · 4.0 ba ·
2,200 sqft ·
Built 2024
· SingleFamily
· Active
· 65 DOM
Cashflow @ list (25.0% down · 7.5%)
Estimated rent
$18,458/mo
Mortgage (P&I)
−$9,833
Tax + insurance
−$3,125
HOA
−$0
Vac / Maint / Mgmt
−$3,876
Net cashflow
$1,624/mo
Annual
$19,490/yr
Cap rate
7.33%
Cash-on-cash
3.71%
DSCR
1.17
1% rule
0.98%
Cash to close
$525,000
Investor read
- This is a 4-bed/4.0-bath single-family listed at $1.88M. Condition is rated good.
- At list price, monthly cash flow is $2k ($19k/yr) — positive.
- The deal already cash-flows at list — no discount required.
- To meet the 1% rule (rent ≥ 1% of price), the offer needs to be $1.85M (1.6% below list).
- It's been on market 65 days — a 6% lower offer ($1.76M) is reasonable based on typical stale-listing flexibility.
- Recommended offer: $1.76M (6.0% below list) — sets the bar for market timing.
- In year one you build about $25k of equity ($13k loan paydown + $12k appreciation (0.6% local appreciation)).
- Location reads 53/100 on livability (#979 in CA) — a working-class tenant base; expect higher turnover. Strengths: employment A+, schools B; Watch: housing C-, crime F, amenities F.
- Santa Monica-Malibu Unified (urban): math 61% / reading 74% proficiency, ranked #123 of 1,400 in CA (top 9%) — acceptable for families but not a draw, mixed tenant base, ~2y average lease.
- Market conditions: Rents falling (-3.4%/yr); 636 active listings in the ZIP; 2 comparable units currently listed for rent nearby; high-income renter base; 19,697 units permitted in Los Angeles County in 2024 (9,426 in 5+ unit buildings).
- Los Angeles County population projected at +9% by 2050 — modest demand growth; plan on rents tracking national, not racing it.
- 8 sale attempts since 2y ago; this cycle's ask is 25942% above the opening price — seller raised mid-cycle; expect resistance to lowballs.
- By year 5, paydown + projected appreciation supports a ~$120k cash-out refi (75% LTV) — recoverable capital for the next deal without selling this one.
- Climate carrying-cost: moderate wildfire risk — expect insurance premiums to compound above CPI over the hold.
- Cap rate 7.3% vs local median 0.7% in Malibu — top-decile yield for the area; either an underpriced asset or a hidden risk that comps aren't pricing in. Stress-test before assuming the spread holds.
- At $18,458/mo this rent would consume 113% of the median local household income ($197k/yr) (locally 420% of renters already pay >50% of income on rent) — very limited rent-growth headroom before tenants either downsize or default.
Questions for listing agent
- It's been on market 65 days. Have you received any prior offers? Is the seller open to a 6% concession, seller financing, or rate buy-down credit?
- Why hasn't it sold? Are there any deal-killer items the seller is aware of (foundation, flood, title, zoning, code violations)?
- Is there a deadline driving the sale (1031 exchange, divorce, estate, relocation)? That informs how much negotiation room exists.
- Schools are B-rated — typically a magnet for longer-tenancy family renters. What's the average tenant stay here, and is there a school-zone premium baked into asking?
- Crime grade is F in this area — have there been break-ins, vandalism, or insurance claims at this property in the last 3 years? What carrier currently insures it and at what premium?
- What's the average days-on-market for RENTAL listings here right now (not sales)? A rising rental-DOM trend means longer vacancies and softer asking-rent achievability than the comps imply.
- What's the recent tenant-quality profile in this submarket — average credit score on applications, eviction rate, late-payment / NSF rate, and stable-employment percentage? A property-management company in the area should have these aggregated.
- How much new for-sale + rental construction is in the pipeline within 1–3 miles? Heavy new supply typically softens prices + rents 12–24 months out; constrained supply supports both.
CashFlowRE · CFR-TB6QRR10YQEES4
· Data 20 h ago
cashflowre.app · 2026-05-29