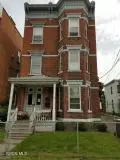
69 Saratoga Ave
Cohoes, NY 12188
$372,000D-
3 bd · 1.5 ba ·
1,832 sqft ·
Built 1900
· SingleFamily
· Pending
· 8 DOM
Cashflow @ list (25.0% down · 7.5%)
Estimated rent
$2,422/mo
Mortgage (P&I)
−$1,951
Tax + insurance
−$417
HOA
−$0
Vac / Maint / Mgmt
−$509
Net cashflow
$-454/mo
Annual
$-5,452/yr
Cap rate
4.83%
Cash-on-cash
-5.23%
DSCR
0.77
1% rule
0.65%
Cash to close
$104,160
Investor read
- This is a 3-bed/1.5-bath single-family listed at $372k.
- At list price, monthly cash flow is $-454 ($-5k/yr) — negative.
- To cash-flow at today's rent, offer at most $292k (21.6% below list).
- To meet the 1% rule (rent ≥ 1% of price), the offer needs to be $242k (34.9% below list).
- Only 8 days on market — expect competitive offers; lowballing is unlikely to land.
- Recommended offer: $242k (34.9% below list) — sets the bar for 1% rule.
- Local home prices are declining (-3.0%/yr); year-one equity from $3k of loan paydown is wiped out by about $11k of value loss. Plan a longer hold.
- Location reads 83/100 on livability (#61 in NY, #895 nationally) — a professional / high-income tenant draw. Strengths: amenities A+, commute A+, housing A+; Watch: employment C-.
- Waterford-Halfmoon Union Free School District (rural): math 60% / reading 54% proficiency, ranked #322 of 755 in NY (top 43%) — acceptable for families but not a draw, mixed tenant base, ~2y average lease.
- Zoned schools: Waterford-Halfmoon Elementary School (math 42% / reading 62%, grade C-, #988 of 2,108 statewide, top 49%, 402 students, 45% FRL); Waterford-Halfmoon Junior-Senior High School (math 62% / reading 44%, grade C-, #934 of 1,100 statewide, top 86%, 336 students, 36% FRL).
- Watch-outs: built in 1900 — expect roof / HVAC / electrical / plumbing capex.
- Market conditions: 48 active listings in the ZIP; 12 comparable units currently listed for rent nearby; rentals at typical pace (median 14d on market — plan ~3-4 weeks tenant-placement turnaround); solid renter incomes; 1,132 units permitted in Saratoga County in 2024 (378 in 5+ unit buildings).
- Saratoga County population projected at +4% by 2050 — modest demand growth; plan on rents tracking national, not racing it.
- 4 sale attempts since 13y ago with the ask held roughly flat each time — persistent listings suggest the price (not the market) is what's stuck; bring a comps-based counter.
- Current owner paid $275k; 35% above their basis — modest negotiation headroom, anchor on the comps not their cost.
- This rent runs 31% of the median local income ($92k/yr) — at the standard rent-burdened threshold; future hikes will face affordability resistance.
Questions for listing agent
- What do current leases actually rent for vs. the listed asking? Can we see a recent rent roll and the last 12 months of T-12 income?
- Built in 1900 — when were the roof, HVAC, electrical panel, plumbing, and water heater last replaced?
- Is there a deadline driving the sale (1031 exchange, divorce, estate, relocation)? That informs how much negotiation room exists.
- The area grade is low — what's the realistic commute time and amenity access for the typical tenant pool here? Any planned neighborhood developments (good or bad) we should know about?
- What's the average days-on-market for RENTAL listings here right now (not sales)? A rising rental-DOM trend means longer vacancies and softer asking-rent achievability than the comps imply.
- What's the recent tenant-quality profile in this submarket — average credit score on applications, eviction rate, late-payment / NSF rate, and stable-employment percentage? A property-management company in the area should have these aggregated.
- How much new for-sale + rental construction is in the pipeline within 1–3 miles? Heavy new supply typically softens prices + rents 12–24 months out; constrained supply supports both.
CashFlowRE · CFR-TCEPTS003EJPST
· Data 6 days ago
cashflowre.app · 2026-05-29