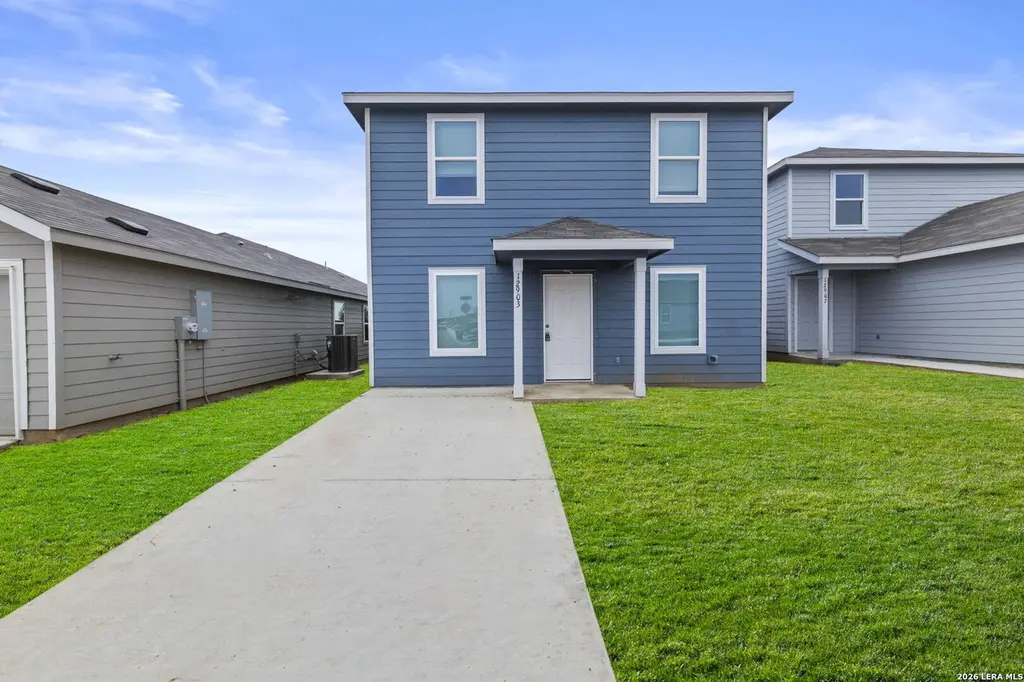
12903 Kathleen St
St. Hedwig, TX 78152
$194,500C
4 bd · 2.5 ba ·
1,802 sqft ·
Built 2025
· SingleFamily
· Active
· 44 DOM
Cashflow @ list (25.0% down · 7.5%)
Estimated rent
$1,824/mo
Mortgage (P&I)
−$1,020
Tax + insurance
−$128
HOA
−$17
Vac / Maint / Mgmt
−$383
Net cashflow
$276/mo
Annual
$3,310/yr
Cap rate
7.99%
Cash-on-cash
6.08%
DSCR
1.27
1% rule
0.94%
Cash to close
$54,460
Investor read
- This is a 4-bed/2.5-bath single-family listed at $194k. Condition is rated good.
- At list price, monthly cash flow is $276 ($3k/yr) — positive.
- The deal already cash-flows at list — no discount required.
- To meet the 1% rule (rent ≥ 1% of price), the offer needs to be $182k (6.2% below list).
- It's been on market 44 days — a 3% lower offer ($189k) is reasonable based on typical stale-listing flexibility.
- Recommended offer: $182k (6.2% below list) — sets the bar for 1% rule.
- In year one you build about $4k of equity ($1k loan paydown + $2k appreciation (1.2% local appreciation)).
- Location reads: area grade C — affects rentability + tenant quality, not the cash-flow math above.
- East Central ISD (rural): math 16% / reading 25% proficiency, ranked #758 of 826 in TX (top 92%) — low school quality limits family demand, transient renter base, plan for 1-2y turnover; 61% free/reduced lunch — lower-income household profile, screen leases tightly.
- Zoned schools: Tradition El (math 25% / reading 32%, grade F, #2,706 of 4,322 statewide, top 63%, 993 students, 51% FRL); East Central H S (math 21% / reading 28%, grade F, #1,264 of 1,632 statewide, top 82%, 3,252 students, 52% FRL).
- Market conditions: Rents soft (-0.9%/yr); 155 active listings in the ZIP; 40 comparable units currently listed for rent nearby; rentals at typical pace (median 16d on market — plan ~3-4 weeks tenant-placement turnaround); high-income renter base; 8,308 units permitted in Bexar County in 2024 (2,506 in 5+ unit buildings).
- Bexar County population projected at +50% by 2050 — long-run rental-demand tailwind backs the buy-and-hold thesis.
- At projected returns (1.2% appreciation + 0.0% rent growth), your $54k cash investment doubles in ~8 years — after that, you're playing with house money.
- By year 9, paydown + projected appreciation supports a ~$34k cash-out refi (75% LTV) — recoverable capital for the next deal without selling this one.
- Cap rate 8.0% vs local median 4.0% in St. Hedwig — top-decile yield for the area; either an underpriced asset or a hidden risk that comps aren't pricing in. Stress-test before assuming the spread holds.
- This rent is only 18% of the median local income ($124k/yr) — well below the 30% rent-burden line; pricing power to push rent on renewal without tenant pushback.
Questions for listing agent
- It's been on market 44 days. Have you received any prior offers? Is the seller open to a 6% concession, seller financing, or rate buy-down credit?
- What does the HOA fee cover, when was the last increase, and are there any pending special assessments or reserve-fund shortfalls?
- Is there a deadline driving the sale (1031 exchange, divorce, estate, relocation)? That informs how much negotiation room exists.
- What's the average days-on-market for RENTAL listings here right now (not sales)? A rising rental-DOM trend means longer vacancies and softer asking-rent achievability than the comps imply.
- What's the recent tenant-quality profile in this submarket — average credit score on applications, eviction rate, late-payment / NSF rate, and stable-employment percentage? A property-management company in the area should have these aggregated.
- How much new for-sale + rental construction is in the pipeline within 1–3 miles? Heavy new supply typically softens prices + rents 12–24 months out; constrained supply supports both.
CashFlowRE · CFR-TDWQPY12DVCTGS
· Data 2 days ago
cashflowre.app · 2026-05-29