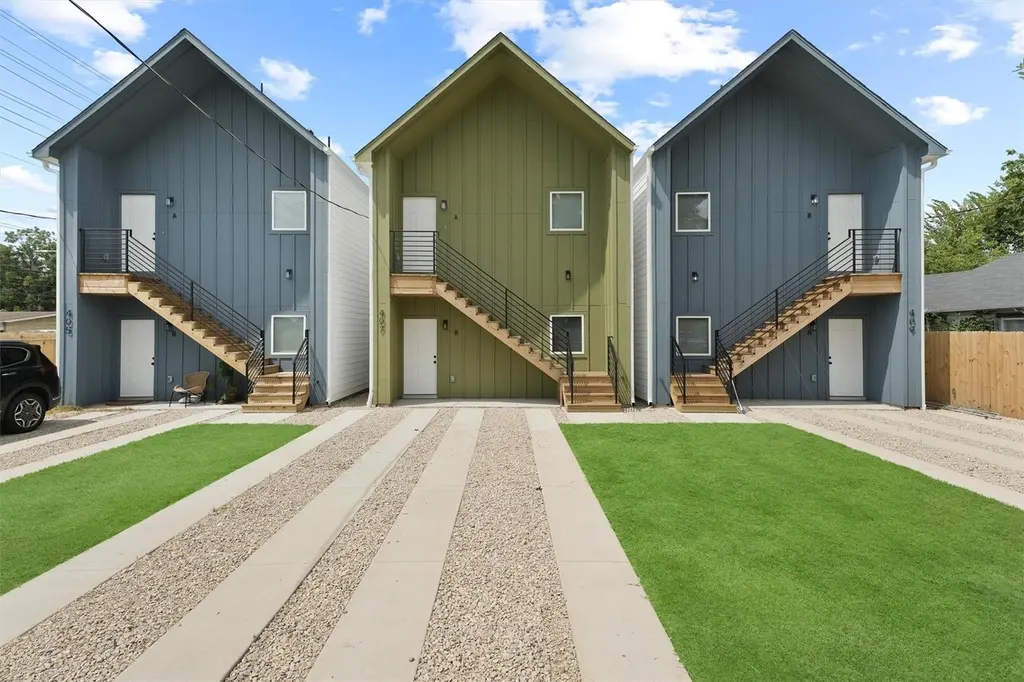
407 Calloway St Unit A - B
Houston, TX 77029
$378,000C-
6 bd · 4.0 ba ·
2,000 sqft ·
Built 2025
· MultiFamily
· Active
· 50 DOM
Cashflow @ list (25.0% down · 7.5%)
Estimated rent
$3,199/mo
Mortgage (P&I)
−$1,943
Tax + insurance
−$617
HOA
−$0
Vac / Maint / Mgmt
−$672
Net cashflow
$-33/mo
Annual
$-398/yr
Cap rate
6.19%
Cash-on-cash
-0.38%
DSCR
0.98
1% rule
0.86%
Cash to close
$103,737
Investor read
- This is a 2 × 3-bed/2.0-bath units multifamily listed at $378k. Condition is rated excellent.
- At list price, monthly cash flow is $-33 ($-398/yr) — negative. Per door: $-17/mo.
- To cash-flow at today's rent, offer at most $366k (3.3% below list).
- To meet the 1% rule (rent ≥ 1% of price), the offer needs to be $320k (15.4% below list).
- It's been on market 50 days — a 3% lower offer ($367k) is reasonable based on typical stale-listing flexibility.
- Recommended offer: $320k (15.4% below list) — sets the bar for 1% rule.
- In year one you build about $40k of equity ($3k loan paydown + $37k appreciation (10.0% local appreciation)).
- Location reads 74/100 on livability (#184 in TX, #4,771 nationally) — a middle-class / working-renter tenant base. Strengths: amenities A+, cost of living A+, housing A+; Watch: crime F.
- Galena Park ISD (suburban): math 32% / reading 33% proficiency, ranked #578 of 826 in TX (top 70%) — families likely to look elsewhere, expect single-tenant / working-renter base with shorter leases; 74% free/reduced lunch — lower-income household profile, screen leases tightly.
- Zoned schools: Jacinto City El (math 31% / reading 32%, grade F, #2,396 of 4,322 statewide, top 56%, 714 students, 89% FRL); Woodland Acres Middle (math 35% / reading 34%, grade F, #858 of 1,662 statewide, top 54%, 603 students, 85% FRL); Galena Park H S (math 37% / reading 36%, grade F, #924 of 1,632 statewide, top 57%, 1,914 students, 87% FRL).
- Market conditions: 153 active listings in the ZIP; 1 comparable units currently listed for rent nearby; 29,883 units permitted in Harris County in 2024 (8,621 in 5+ unit buildings).
- Harris County population projected at +47% by 2050 — long-run rental-demand tailwind backs the buy-and-hold thesis.
- At projected returns (10.0% appreciation + 3.0% rent growth), your $104k cash investment doubles in ~3 years — after that, you're playing with house money.
- By year 2, paydown + projected appreciation supports a ~$64k cash-out refi (75% LTV) — recoverable capital for the next deal without selling this one.
- Climate carrying-cost: major flood risk; severe wind risk, 99% chance of damaging wind over 30y; extreme-heat days projected 6→20/yr by 2055 (HVAC capex compounding) — expect insurance premiums to compound above CPI over the hold.
- Cap rate 6.2% vs local median 3.2% in Houston — top-decile yield for the area; either an underpriced asset or a hidden risk that comps aren't pricing in. Stress-test before assuming the spread holds.
- At $3,199/mo this rent would consume 80% of the median local household income ($48k/yr) (locally 457% of renters already pay >50% of income on rent) — very limited rent-growth headroom before tenants either downsize or default.
Questions for listing agent
- What do current leases actually rent for vs. the listed asking? Can we see a recent rent roll and the last 12 months of T-12 income?
- It's been on market 50 days. Have you received any prior offers? Is the seller open to a 15% concession, seller financing, or rate buy-down credit?
- Can we see the unit-by-unit rent roll, current vacancy, and any below-market leases? What's the average tenancy length?
- What capital expenditures (roof, boiler, parking lot, exteriors) have been made in the last 5 years, and what's planned in the next 2?
- Is there a deadline driving the sale (1031 exchange, divorce, estate, relocation)? That informs how much negotiation room exists.
- Schools are D-rated, which usually means shorter tenancies and higher turnover. Who's the typical renter profile here, and what's been the actual vacancy rate?
- Crime grade is F in this area — have there been break-ins, vandalism, or insurance claims at this property in the last 3 years? What carrier currently insures it and at what premium?
- What's the average days-on-market for RENTAL listings here right now (not sales)? A rising rental-DOM trend means longer vacancies and softer asking-rent achievability than the comps imply.
CashFlowRE · CFR-TEABB5DVBK1W7E
· Data 2 days ago
cashflowre.app · 2026-05-29