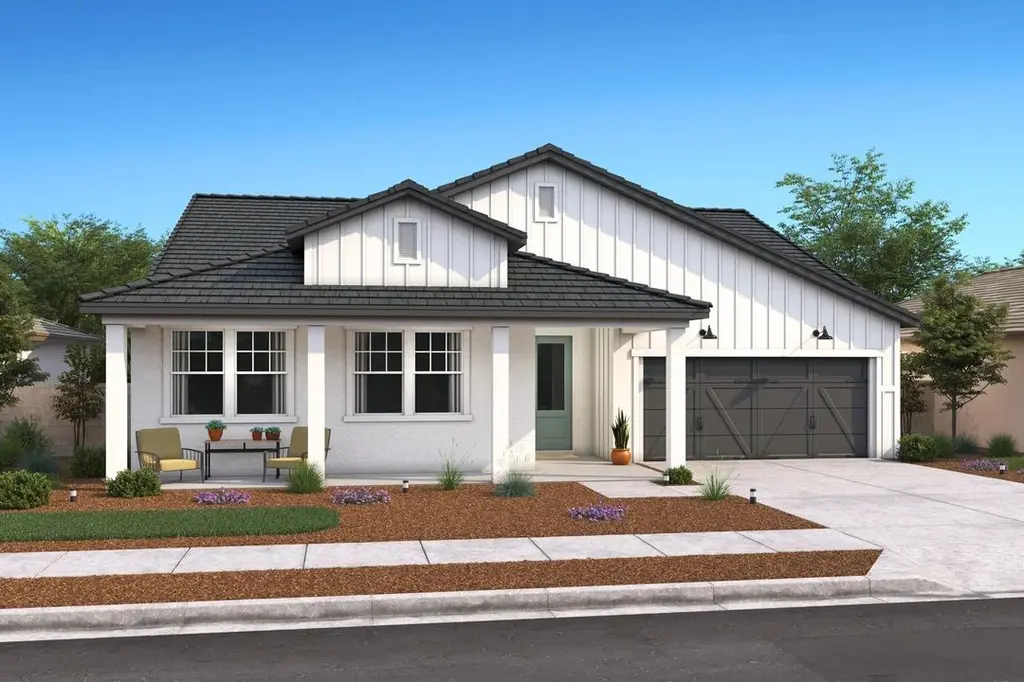
8147 Cottonwood Dr
Friant, CA 93626
$544,990D-
4 bd · 3.0 ba ·
2,406 sqft ·
Built 2026
· SingleFamily
· Active
· 17 DOM
Cashflow @ list (25.0% down · 7.5%)
Estimated rent
$2,350/mo
Mortgage (P&I)
−$2,858
Tax + insurance
−$908
HOA
−$197
Vac / Maint / Mgmt
−$494
Net cashflow
$-2,107/mo
Annual
$-25,282/yr
Cap rate
1.65%
Cash-on-cash
-16.57%
DSCR
0.26
1% rule
0.43%
Cash to close
$152,597
Investor read
- This is a 4-bed/3.0-bath single-family listed at $545k.
- At list price, monthly cash flow is $-2k ($-25k/yr) — negative.
- To cash-flow at today's rent, offer at most $240k (55.9% below list).
- To meet the 1% rule (rent ≥ 1% of price), the offer needs to be $235k (56.9% below list).
- It's been on market 17 days — a 2% lower offer ($537k) is reasonable based on typical stale-listing flexibility.
- Recommended offer: $235k (56.9% below list) — sets the bar for 1% rule.
- In year one you build about $58k of equity ($4k loan paydown + $54k appreciation (10.0% local appreciation)).
- Location reads 44/100 on livability (#1,341 in CA) — a working-class tenant base; expect higher turnover. Strengths: housing A+, health & safety A; Watch: cost of living D+, employment D, crime F.
- Clovis Unified (suburban): math 58% / reading 72% proficiency, ranked #152 of 1,400 in CA (top 11%) — acceptable for families but not a draw, mixed tenant base, ~2y average lease.
- Zoned schools: Liberty Elementary (621 students, 39% FRL); Kastner Intermediate (1,133 students, 56% FRL); Clovis West High (2,089 students, 44% FRL).
- Market conditions: 102 active listings in the ZIP; 1 comparable units currently listed for rent nearby; 2,426 units permitted in Fresno County in 2024 (296 in 5+ unit buildings).
- Fresno County population projected at +11% by 2050 — modest demand growth; plan on rents tracking national, not racing it.
- 2 sale attempts with the ask held roughly flat each time — persistent listings suggest the price (not the market) is what's stuck; bring a comps-based counter.
- By year 2, paydown + projected appreciation supports a ~$94k cash-out refi (75% LTV) — recoverable capital for the next deal without selling this one.
- Cap rate 1.7% vs local median 2.3% in Friant — below-typical yield; the buyer is paying a premium for something (appreciation thesis, condition, location) that the cap rate doesn't capture.
Questions for listing agent
- What do current leases actually rent for vs. the listed asking? Can we see a recent rent roll and the last 12 months of T-12 income?
- What does the HOA fee cover, when was the last increase, and are there any pending special assessments or reserve-fund shortfalls?
- Is there a deadline driving the sale (1031 exchange, divorce, estate, relocation)? That informs how much negotiation room exists.
- Schools are F-rated, which usually means shorter tenancies and higher turnover. Who's the typical renter profile here, and what's been the actual vacancy rate?
- Crime grade is F in this area — have there been break-ins, vandalism, or insurance claims at this property in the last 3 years? What carrier currently insures it and at what premium?
- The area grade is low — what's the realistic commute time and amenity access for the typical tenant pool here? Any planned neighborhood developments (good or bad) we should know about?
- What's the average days-on-market for RENTAL listings here right now (not sales)? A rising rental-DOM trend means longer vacancies and softer asking-rent achievability than the comps imply.
- What's the recent tenant-quality profile in this submarket — average credit score on applications, eviction rate, late-payment / NSF rate, and stable-employment percentage? A property-management company in the area should have these aggregated.
CashFlowRE · CFR-TEQW000JXQC183
· Data 1 day ago
cashflowre.app · 2026-05-29