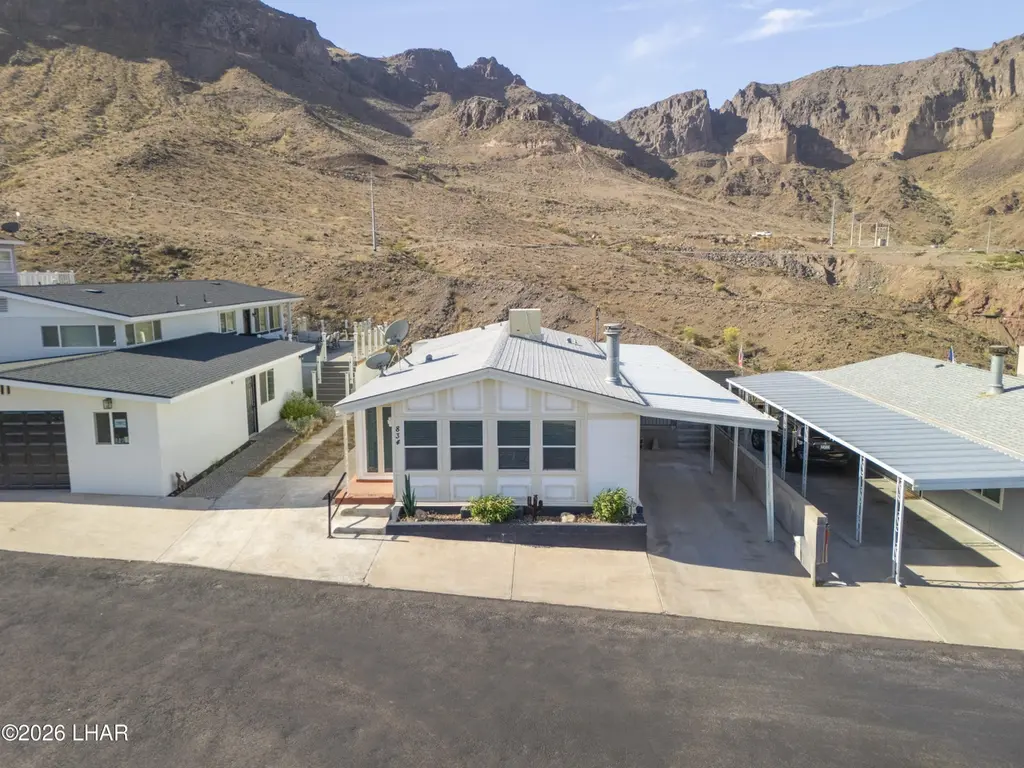
834 Noble View Dr
Parker Strip, AZ 85344
$289,999D
2 bd · 2.0 ba ·
1,344 sqft ·
Built 1984
· Manufactured
· Active
· 74 DOM
Cashflow @ list (25.0% down · 7.5%)
Estimated rent
$2,040/mo
Mortgage (P&I)
−$1,521
Tax + insurance
−$198
HOA
−$27
Vac / Maint / Mgmt
−$428
Net cashflow
$-134/mo
Annual
$-1,607/yr
Cap rate
5.74%
Cash-on-cash
-1.98%
DSCR
0.91
1% rule
0.70%
Cash to close
$81,200
Investor read
- This is a 2-bed/2.0-bath manufactured listed at $290k.
- At list price, monthly cash flow is $-134 ($-2k/yr) — negative.
- To cash-flow at today's rent, offer at most $266k (8.2% below list).
- To meet the 1% rule (rent ≥ 1% of price), the offer needs to be $204k (29.7% below list).
- It's been on market 74 days — a 6% lower offer ($273k) is reasonable based on typical stale-listing flexibility.
- Recommended offer: $204k (29.7% below list) — sets the bar for 1% rule.
- Local home prices are declining (-3.0%/yr); year-one equity from $2k of loan paydown is wiped out by about $9k of value loss. Plan a longer hold.
- Location reads 61/100 on livability (#150 in AZ) — a middle-class / working-renter tenant base. Strengths: cost of living A, housing A, crime B+; Watch: health & safety C-, amenities F, commute F.
- Parker Unified School District (4510) (town): math 18% / reading 18% proficiency, ranked #200 of 249 in AZ (top 80%) — low school quality limits family demand, transient renter base, plan for 1-2y turnover; 69% free/reduced lunch — lower-income household profile, screen leases tightly.
- Zoned schools: Blake Primary School (354 students, 70% FRL); Wallace Jr High School (math 15% / reading 18%, grade F, #151 of 218 statewide, top 70%, 303 students, 73% FRL); Parker High School (math 8% / reading 12%, grade F, #343 of 381 statewide, top 93%, 507 students, 69% FRL) — zoned schools at 70% FRL track the district average.
- Market conditions: 147 active listings in the ZIP; 92 units permitted in La Paz County in 2024 (0 in 5+ unit buildings).
- La Paz County population projected at -11% by 2050 — secular population decline; favor cash flow + early exit over multi-decade hold.
- 4 sale attempts since 10y ago with the ask held roughly flat each time — persistent listings suggest the price (not the market) is what's stuck; bring a comps-based counter.
- Climate carrying-cost: extreme-heat days projected 6→14/yr by 2055 (HVAC capex compounding) — expect insurance premiums to compound above CPI over the hold.
- Cap rate 5.7% vs local median 3.7% in Parker Strip — top-decile yield for the area; either an underpriced asset or a hidden risk that comps aren't pricing in. Stress-test before assuming the spread holds.
Questions for listing agent
- What do current leases actually rent for vs. the listed asking? Can we see a recent rent roll and the last 12 months of T-12 income?
- It's been on market 74 days. Have you received any prior offers? Is the seller open to a 30% concession, seller financing, or rate buy-down credit?
- What does the HOA fee cover, when was the last increase, and are there any pending special assessments or reserve-fund shortfalls?
- Why hasn't it sold? Are there any deal-killer items the seller is aware of (foundation, flood, title, zoning, code violations)?
- Is there a deadline driving the sale (1031 exchange, divorce, estate, relocation)? That informs how much negotiation room exists.
- Schools are D-rated, which usually means shorter tenancies and higher turnover. Who's the typical renter profile here, and what's been the actual vacancy rate?
- The area grade is low — what's the realistic commute time and amenity access for the typical tenant pool here? Any planned neighborhood developments (good or bad) we should know about?
- What's the average days-on-market for RENTAL listings here right now (not sales)? A rising rental-DOM trend means longer vacancies and softer asking-rent achievability than the comps imply.
CashFlowRE · CFR-TG1SRD378YEK6C
· Data 19 h ago
cashflowre.app · 2026-05-29