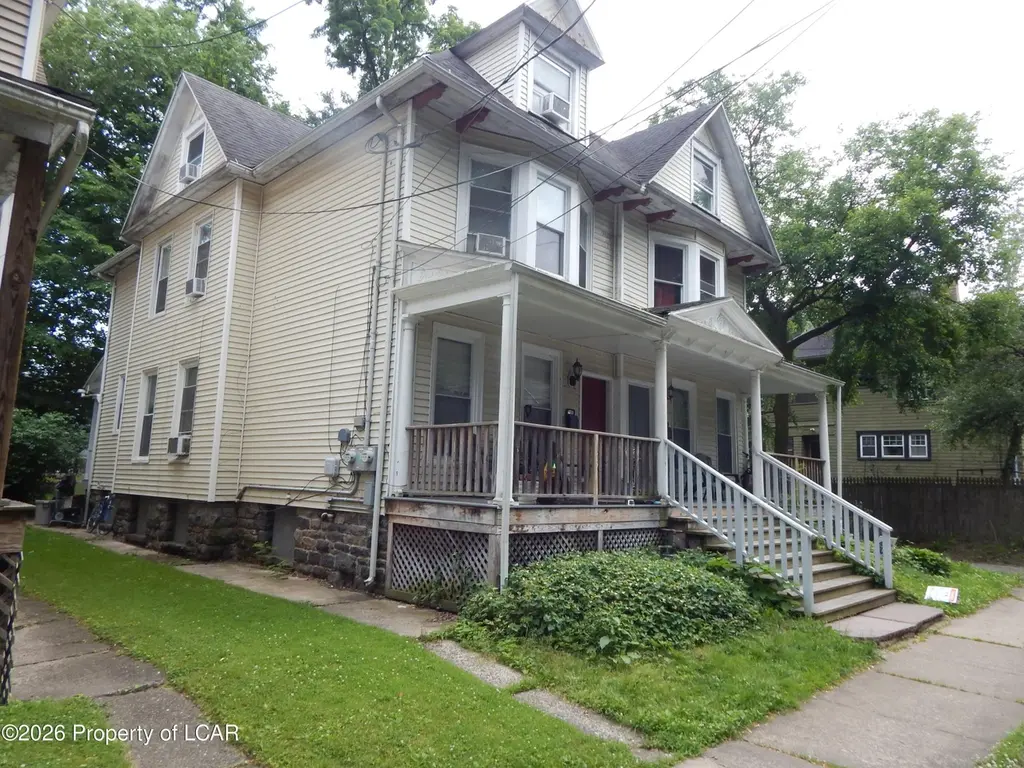
28-30 Sheldon St
Wilkes-Barre, PA 18702
$255,000B-
10 bd · 5.0 ba ·
3,550 sqft ·
Built —
· MultiFamily
· Active
· 6 DOM
Cashflow @ list (25.0% down · 7.5%)
Estimated rent
$4,303/mo
Mortgage (P&I)
−$1,337
Tax + insurance
−$491
HOA
−$0
Vac / Maint / Mgmt
−$904
Net cashflow
$1,571/mo
Annual
$18,848/yr
Cap rate
14.00%
Cash-on-cash
27.51%
DSCR
2.22
1% rule
1.69%
Cash to close
$71,400
Investor read
- This is a 2 × 5-bed/?-bath units multifamily listed at $255k. Condition is rated fair.
- At list price, monthly cash flow is $2k ($19k/yr) — positive. Per door: $785/mo.
- The deal already cash-flows at list — no discount required.
- Meets the 1% rule at list price ($4k rent vs $255k).
- Only 6 days on market — expect competitive offers; lowballing is unlikely to land.
- Local home prices are declining (-3.0%/yr); year-one equity from $2k of loan paydown is wiped out by about $8k of value loss. Plan a longer hold.
- Location reads: area grade B — affects rentability + tenant quality, not the cash-flow math above.
- Wilkes-Barre Area SD (urban): math 19% / reading 32% proficiency, ranked #469 of 539 in PA (top 87%) — low school quality limits family demand, transient renter base, plan for 1-2y turnover; 61% free/reduced lunch — lower-income household profile, screen leases tightly.
- Watch-outs: flood insurance adds $66/mo.
- Market conditions: Rents rising fast (+6.8%/yr); 221 active listings in the ZIP; 349 units permitted in Luzerne County in 2024 (16 in 5+ unit buildings).
- Luzerne County population projected at +4% by 2050 — modest demand growth; plan on rents tracking national, not racing it.
- At projected returns (-3.0% appreciation + 6.8% rent growth), your $71k cash investment doubles in ~5 years — after that, you're playing with house money.
- Climate carrying-cost: major flood risk — expect insurance premiums to compound above CPI over the hold.
- Cap rate 14.0% vs local median 5.6% in Wilkes-Barre — top-decile yield for the area; either an underpriced asset or a hidden risk that comps aren't pricing in. Stress-test before assuming the spread holds.
- At $4,303/mo this rent would consume 92% of the median local household income ($56k/yr) (locally 1632% of renters already pay >50% of income on rent) — very limited rent-growth headroom before tenants either downsize or default.
Questions for listing agent
- Can we see the unit-by-unit rent roll, current vacancy, and any below-market leases? What's the average tenancy length?
- What capital expenditures (roof, boiler, parking lot, exteriors) have been made in the last 5 years, and what's planned in the next 2?
- Have any recent inspections been done? Can we get a copy of the seller's disclosures and any deferred-maintenance estimates?
- What's the actual annual flood-insurance premium (NFIP or private), and is the property in a SFHA with mandatory coverage?
- Is there a deadline driving the sale (1031 exchange, divorce, estate, relocation)? That informs how much negotiation room exists.
- What's the average days-on-market for RENTAL listings here right now (not sales)? A rising rental-DOM trend means longer vacancies and softer asking-rent achievability than the comps imply.
- What's the recent tenant-quality profile in this submarket — average credit score on applications, eviction rate, late-payment / NSF rate, and stable-employment percentage? A property-management company in the area should have these aggregated.
- How much new apartment / multifamily construction is in the pipeline within 1–3 miles? Heavy new supply (>2% of stock underway) typically softens rents 12–24 months out; light construction supports rent growth.
Repairs flagged (vision-AI assessment)
- Major: Front porch railings — Significant damage and missing sections.
- Moderate: Exterior siding — Worn and may need repainting or replacement.
- Minor: Kitchen countertops — Slight wear, could be refinished or replaced.
- Minor: Bathroom tiles — Worn, could be replaced or sealed.
- Minor: Paint — Chipped in some areas, could be touched up or repainted.
- Minor: Windows — May need cleaning or replacement of seals.
CashFlowRE · CFR-TH4Q3G5T33QZ8G
· Data 3 days ago
cashflowre.app · 2026-05-29