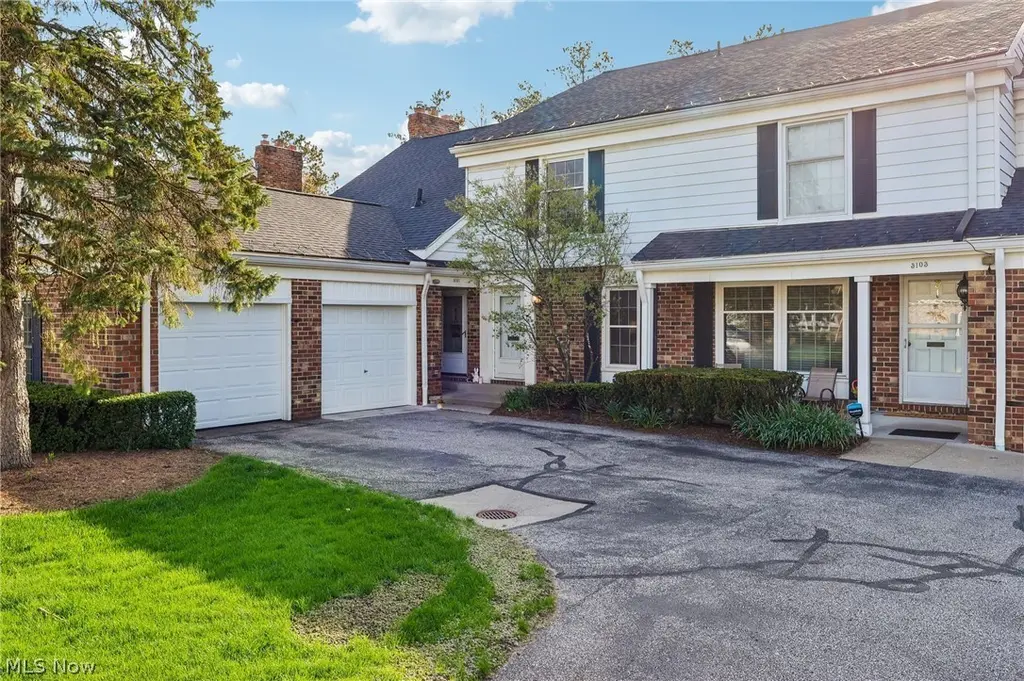
34104 Chagrin Blvd #3102
Moreland Hills, OH 44022
$239,000B
2 bd · 2.5 ba ·
1,185 sqft ·
Built 1972
· Condo
· Pending
· 41 DOM
Cashflow @ list (25.0% down · 7.5%)
Estimated rent
$6,507/mo
Mortgage (P&I)
−$1,253
Tax + insurance
−$497
HOA
−$435
Vac / Maint / Mgmt
−$1,366
Net cashflow
$2,956/mo
Annual
$35,467/yr
Cap rate
21.13%
Cash-on-cash
53.00%
DSCR
3.36
1% rule
2.72%
Cash to close
$66,920
Investor read
- This is a 2-bed/2.5-bath condo listed at $239k.
- At list price, monthly cash flow is $3k ($35k/yr) — positive.
- The deal already cash-flows at list — no discount required.
- Meets the 1% rule at list price ($7k rent vs $239k).
- It's been on market 41 days — a 3% lower offer ($232k) is reasonable based on typical stale-listing flexibility.
- Recommended offer: $232k (3.0% below list) — sets the bar for market timing.
- Local home prices are declining (-3.0%/yr); year-one equity from $2k of loan paydown is wiped out by about $7k of value loss. Plan a longer hold.
- Location reads 64/100 on livability (#788 in OH) — a middle-class / working-renter tenant base. Strengths: crime A+, employment A+, housing A+; Watch: amenities F, commute F, cost of living F.
- Orange City (suburban): math 76% / reading 83% proficiency, ranked #32 of 656 in OH (top 5%) — strong family-tenant draw, lease renewals of 3-5y typical; only 11% free/reduced lunch — higher-income household profile.
- Market conditions: 125 active listings in the ZIP; 1 comparable units currently listed for rent nearby; high-income renter base; 1,441 units permitted in Cuyahoga County in 2024 (700 in 5+ unit buildings).
- Cuyahoga County population projected to shrink 8% by 2050 — rents likely to lag national; underwrite the cash flow, not the appreciation.
- 6 sale attempts since 22y ago with the ask held roughly flat each time — persistent listings suggest the price (not the market) is what's stuck; bring a comps-based counter.
- Current owner paid $149k; list at $239k implies a 60% gain — meaningful room to come down on a strong offer.
- At projected returns (-3.0% appreciation + 3.0% rent growth), your $67k cash investment doubles in ~3 years — after that, you're playing with house money.
- Cap rate 21.1% vs local median 1.2% in Moreland Hills — top-decile yield for the area; either an underpriced asset or a hidden risk that comps aren't pricing in. Stress-test before assuming the spread holds.
- At $6,507/mo this rent would consume 51% of the median local household income ($152k/yr) — very limited rent-growth headroom before tenants either downsize or default.
Questions for listing agent
- It's been on market 41 days. Have you received any prior offers? Is the seller open to a 3% concession, seller financing, or rate buy-down credit?
- Built in 1972 — when were the roof, HVAC, electrical panel, plumbing, and water heater last replaced?
- What does the HOA fee cover, when was the last increase, and are there any pending special assessments or reserve-fund shortfalls?
- Any open or pending special assessments — roof, HVAC, plumbing, elevator, façade? What's the per-unit balance and payoff schedule, and is the seller paying it off at close or rolling it to the buyer?
- Is there a deadline driving the sale (1031 exchange, divorce, estate, relocation)? That informs how much negotiation room exists.
- What's the average days-on-market for RENTAL listings here right now (not sales)? A rising rental-DOM trend means longer vacancies and softer asking-rent achievability than the comps imply.
- What's the recent tenant-quality profile in this submarket — average credit score on applications, eviction rate, late-payment / NSF rate, and stable-employment percentage? A property-management company in the area should have these aggregated.
- How much new apartment / multifamily construction is in the pipeline within 1–3 miles? Heavy new supply (>2% of stock underway) typically softens rents 12–24 months out; light construction supports rent growth.
CashFlowRE · CFR-THTZG4E8K10JWD
· Data 2 weeks ago
cashflowre.app · 2026-05-29