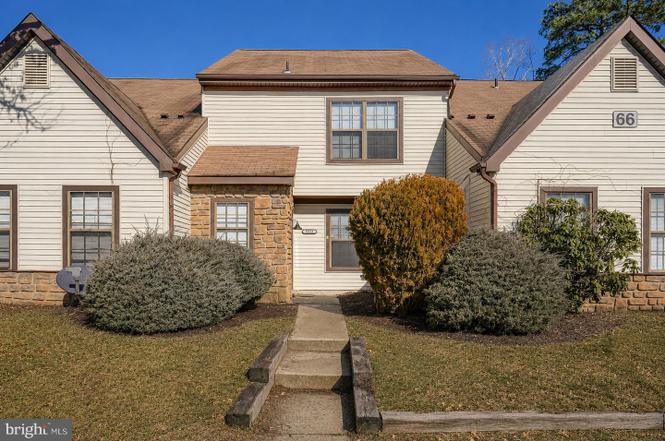
3312 Larkspur Ct
McKee City, NJ 08330
$230,000D+
3 bd · 2.5 ba ·
1,249 sqft ·
Built 1986
· Townhouse
· Active
· 9 DOM
Cashflow @ list (25.0% down · 7.5%)
Estimated rent
$2,583/mo
Mortgage (P&I)
−$1,206
Tax + insurance
−$383
HOA
−$400
Vac / Maint / Mgmt
−$542
Net cashflow
$51/mo
Annual
$612/yr
Cap rate
6.56%
Cash-on-cash
0.95%
DSCR
1.04
1% rule
1.12%
Cash to close
$64,400
Investor read
- This is a 3-bed/2.5-bath townhouse listed at $230k.
- At list price, monthly cash flow is $51 ($612/yr) — positive.
- The deal already cash-flows at list — no discount required.
- Meets the 1% rule at list price ($3k rent vs $230k).
- Only 9 days on market — expect competitive offers; lowballing is unlikely to land.
- In year one you build about $25k of equity ($2k loan paydown + $23k appreciation (10.0% local appreciation)).
- Location reads: area grade D — affects rentability + tenant quality, not the cash-flow math above.
- Hamilton Township School District (suburban): math 9% / reading 37% proficiency, ranked #401 of 472 in NJ (top 85%) — low school quality limits family demand, transient renter base, plan for 1-2y turnover.
- Market conditions: 244 active listings in the ZIP; 7 comparable units currently listed for rent nearby; rentals at typical pace (median 15d on market — plan ~3-4 weeks tenant-placement turnaround); solid renter incomes; 672 units permitted in Atlantic County in 2024 (258 in 5+ unit buildings).
- Atlantic County population projected at -12% by 2050 — secular population decline; favor cash flow + early exit over multi-decade hold.
- 4 sale attempts with the ask held roughly flat each time — persistent listings suggest the price (not the market) is what's stuck; bring a comps-based counter.
- At projected returns (10.0% appreciation + 3.0% rent growth), your $64k cash investment doubles in ~3 years — after that, you're playing with house money.
- By year 2, paydown + projected appreciation supports a ~$40k cash-out refi (75% LTV) — recoverable capital for the next deal without selling this one.
- Climate carrying-cost: severe wind risk, 80% chance of damaging wind over 30y; extreme-heat days projected 7→15/yr by 2055 (HVAC capex compounding) — expect insurance premiums to compound above CPI over the hold.
- Cap rate 6.6% vs local median 4.4% in McKee City — top-decile yield for the area; either an underpriced asset or a hidden risk that comps aren't pricing in. Stress-test before assuming the spread holds.
- This rent runs 40% of the median local income ($77k/yr) — at the standard rent-burdened threshold; future hikes will face affordability resistance.
Questions for listing agent
- What does the HOA fee cover, when was the last increase, and are there any pending special assessments or reserve-fund shortfalls?
- Is there a deadline driving the sale (1031 exchange, divorce, estate, relocation)? That informs how much negotiation room exists.
- The area grade is low — what's the realistic commute time and amenity access for the typical tenant pool here? Any planned neighborhood developments (good or bad) we should know about?
- What's the average days-on-market for RENTAL listings here right now (not sales)? A rising rental-DOM trend means longer vacancies and softer asking-rent achievability than the comps imply.
- What's the recent tenant-quality profile in this submarket — average credit score on applications, eviction rate, late-payment / NSF rate, and stable-employment percentage? A property-management company in the area should have these aggregated.
- How much new for-sale + rental construction is in the pipeline within 1–3 miles? Heavy new supply typically softens prices + rents 12–24 months out; constrained supply supports both.
CashFlowRE · CFR-TJGACY3QYWYH3R
· Data 2 days ago
cashflowre.app · 2026-05-29