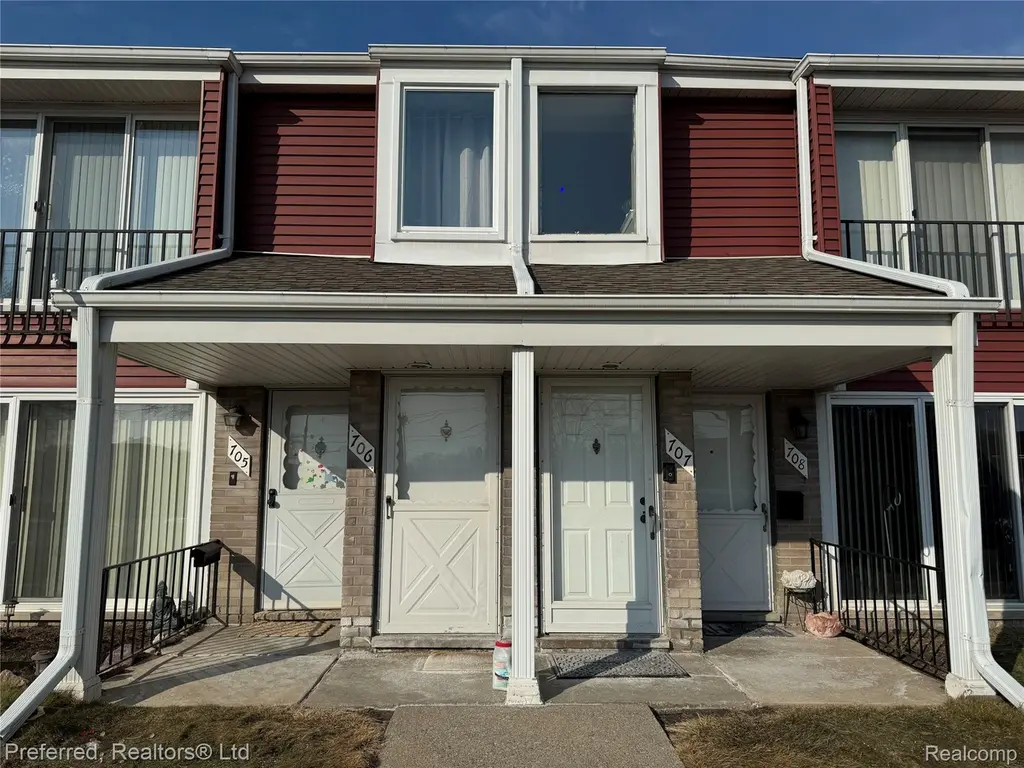
706 Sunset Ln #63
St. Clair Shores, MI 48082
$114,900C-
2 bd · 1.0 ba ·
978 sqft ·
Built 1977
· Condo
· Pending
· 3 DOM
Cashflow @ list (25.0% down · 7.5%)
Estimated rent
$1,421/mo
Mortgage (P&I)
−$603
Tax + insurance
−$157
HOA
−$220
Vac / Maint / Mgmt
−$298
Net cashflow
$143/mo
Annual
$1,722/yr
Cap rate
7.79%
Cash-on-cash
5.35%
DSCR
1.24
1% rule
1.24%
Cash to close
$32,172
Investor read
- This is a 2-bed/1.0-bath condo listed at $115k.
- At list price, monthly cash flow is $143 ($2k/yr) — positive.
- The deal already cash-flows at list — no discount required.
- Meets the 1% rule at list price ($1k rent vs $115k).
- Only 3 days on market — expect competitive offers; lowballing is unlikely to land.
- Local home prices are declining (-3.0%/yr); year-one equity from $794 of loan paydown is wiped out by about $3k of value loss. Plan a longer hold.
- Location reads: area grade C — affects rentability + tenant quality, not the cash-flow math above.
- Lake Shore Public Schools (Macomb) (suburban): math 22% / reading 40% proficiency, ranked #334 of 540 in MI (top 62%) — families likely to look elsewhere, expect single-tenant / working-renter base with shorter leases.
- Zoned schools: Masonic Heights Elementary School (math 27% / reading 32%, grade F, #866 of 1,397 statewide, top 65%, 473 students, 58% FRL); Kennedy Middle School (math 25% / reading 45%, grade F, #283 of 493 statewide, top 58%, 694 students, 55% FRL); Lake Shore High School (math 19% / reading 51%, grade F, #368 of 713 statewide, top 52%, 950 students, 49% FRL) — zoned schools average 54% FRL vs 36% district-wide (18 pts higher); higher-poverty schools than district average — tighter screening recommended.
- Market conditions: 122 active listings in the ZIP; 8 comparable units currently listed for rent nearby; rentals at typical pace (median 24d on market — plan ~3-4 weeks tenant-placement turnaround); 1,321 units permitted in Macomb County in 2024 (86 in 5+ unit buildings).
- Macomb County population projected at +9% by 2050 — modest demand growth; plan on rents tracking national, not racing it.
- 2 sale attempts with the ask held roughly flat each time — persistent listings suggest the price (not the market) is what's stuck; bring a comps-based counter.
- Current owner paid $64k; list at $115k implies a 80% gain — meaningful room to come down on a strong offer.
- Cap rate 7.8% vs local median 4.0% in St. Clair Shores — top-decile yield for the area; either an underpriced asset or a hidden risk that comps aren't pricing in. Stress-test before assuming the spread holds.
Questions for listing agent
- Built in 1977 — when were the roof, HVAC, electrical panel, plumbing, and water heater last replaced?
- What does the HOA fee cover, when was the last increase, and are there any pending special assessments or reserve-fund shortfalls?
- Any open or pending special assessments — roof, HVAC, plumbing, elevator, façade? What's the per-unit balance and payoff schedule, and is the seller paying it off at close or rolling it to the buyer?
- Is there a deadline driving the sale (1031 exchange, divorce, estate, relocation)? That informs how much negotiation room exists.
- What's the average days-on-market for RENTAL listings here right now (not sales)? A rising rental-DOM trend means longer vacancies and softer asking-rent achievability than the comps imply.
- What's the recent tenant-quality profile in this submarket — average credit score on applications, eviction rate, late-payment / NSF rate, and stable-employment percentage? A property-management company in the area should have these aggregated.
- How much new apartment / multifamily construction is in the pipeline within 1–3 miles? Heavy new supply (>2% of stock underway) typically softens rents 12–24 months out; light construction supports rent growth.
CashFlowRE · CFR-TJKMWD4QK0C466
· Data 1 week ago
cashflowre.app · 2026-05-29