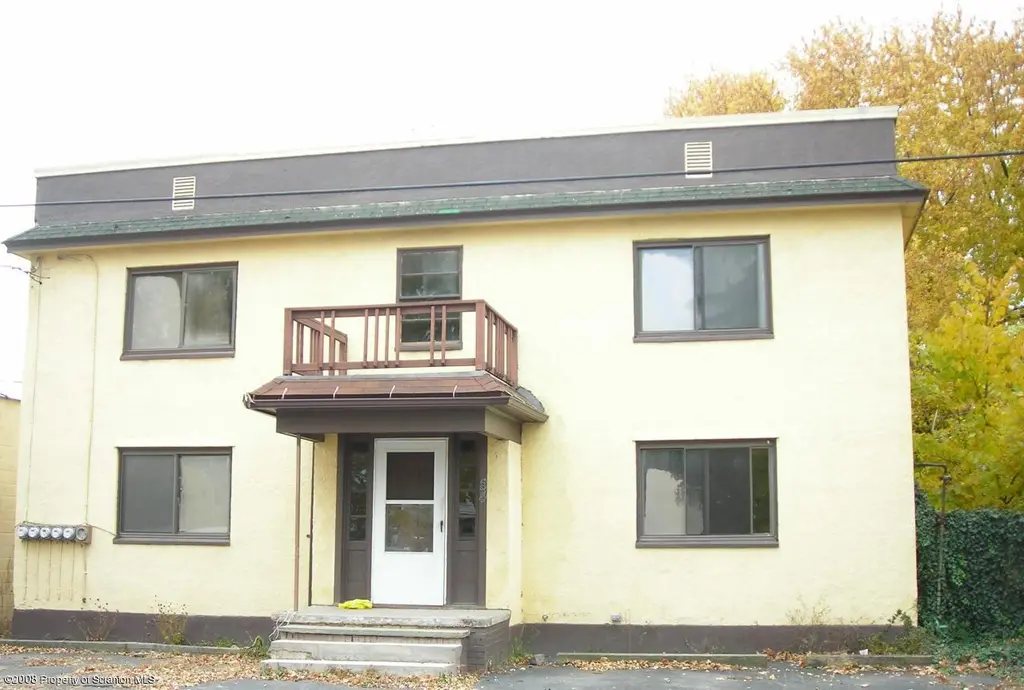
84 Academy St
Kingston, PA 18704
$109,000D+
8 bd · 4.0 ba ·
3,704 sqft ·
Built 1930
· MultiFamily
· Pending
Cashflow @ list (25.0% down · 7.5%)
Estimated rent
$5,225/mo
Mortgage (P&I)
−$572
Tax + insurance
−$376
HOA
−$0
Vac / Maint / Mgmt
−$1,097
Net cashflow
$3,180/mo
Annual
$38,164/yr
Cap rate
42.04%
Cash-on-cash
127.66%
DSCR
6.68
1% rule
4.79%
Cash to close
$30,520
Investor read
- This is a 4 × 2-bed/1.0-bath units multifamily listed at $109k.
- At list price, monthly cash flow is $3k ($38k/yr) — positive. Per door: $795/mo.
- The deal already cash-flows at list — no discount required.
- Meets the 1% rule at list price ($5k rent vs $109k).
- Only 0 days on market — expect competitive offers; lowballing is unlikely to land.
- Local home prices are declining (-3.0%/yr); year-one equity from $754 of loan paydown is wiped out by about $3k of value loss. Plan a longer hold.
- Location reads 81/100 on livability (#162 in PA, #1,345 nationally) — a professional / high-income tenant draw. Strengths: cost of living A+, health & safety A+, housing A; Watch: employment D, commute F.
- Wyoming Valley West SD (suburban): math 18% / reading 42% proficiency, ranked #445 of 539 in PA (top 83%) — families likely to look elsewhere, expect single-tenant / working-renter base with shorter leases.
- Watch-outs: property tax is 2.9% of price; flood insurance adds $66/mo; built in 1930 — expect roof / HVAC / electrical / plumbing capex.
- Market conditions: Rents rising fast (+4.7%/yr); 132 active listings in the ZIP; 349 units permitted in Luzerne County in 2024 (16 in 5+ unit buildings).
- Luzerne County population projected at +4% by 2050 — modest demand growth; plan on rents tracking national, not racing it.
- Current owner paid $85k; 28% above their basis — modest negotiation headroom, anchor on the comps not their cost.
- At projected returns (-3.0% appreciation + 4.7% rent growth), your $31k cash investment doubles in ~1 year — after that, you're playing with house money.
- Climate carrying-cost: severe flood risk — expect insurance premiums to compound above CPI over the hold.
- Cap rate 42.0% vs local median 5.0% in Kingston — top-decile yield for the area; either an underpriced asset or a hidden risk that comps aren't pricing in. Stress-test before assuming the spread holds.
- At $5,225/mo this rent would consume 97% of the median local household income ($64k/yr) (locally 1454% of renters already pay >50% of income on rent) — very limited rent-growth headroom before tenants either downsize or default.
Questions for listing agent
- Can we see the unit-by-unit rent roll, current vacancy, and any below-market leases? What's the average tenancy length?
- What capital expenditures (roof, boiler, parking lot, exteriors) have been made in the last 5 years, and what's planned in the next 2?
- Built in 1930 — when were the roof, HVAC, electrical panel, plumbing, and water heater last replaced?
- Property tax is high relative to price — has the assessment been appealed recently, and will the sale trigger a re-assessment?
- What's the actual annual flood-insurance premium (NFIP or private), and is the property in a SFHA with mandatory coverage?
- Is there a deadline driving the sale (1031 exchange, divorce, estate, relocation)? That informs how much negotiation room exists.
- The area grade is low — what's the realistic commute time and amenity access for the typical tenant pool here? Any planned neighborhood developments (good or bad) we should know about?
- What's the average days-on-market for RENTAL listings here right now (not sales)? A rising rental-DOM trend means longer vacancies and softer asking-rent achievability than the comps imply.
CashFlowRE · CFR-TPG6HMBEY3KWWR
· Data 3 weeks ago
cashflowre.app · 2026-05-29