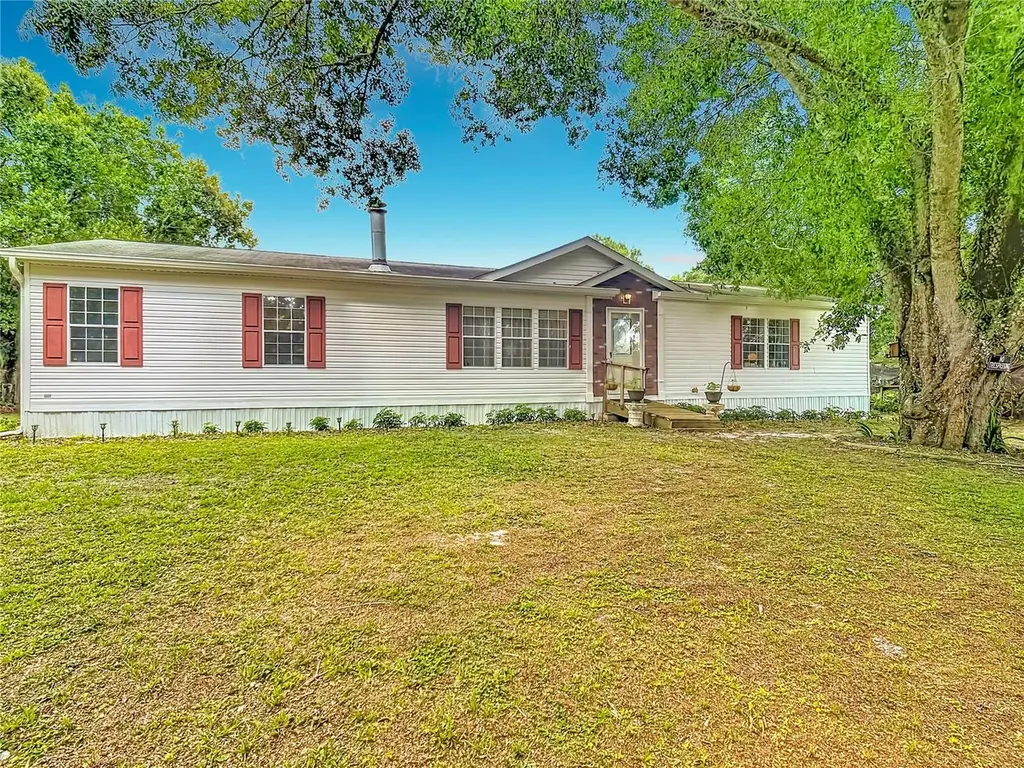
255 Grant Bass Rd
Kenansville, FL 34739
$215,000D+
3 bd · 2.0 ba ·
1,980 sqft ·
Built 2008
· Manufactured
· Pending
· 12 DOM
Cashflow @ list (25.0% down · 7.5%)
Estimated rent
$1,740/mo
Mortgage (P&I)
−$1,127
Tax + insurance
−$203
HOA
−$0
Vac / Maint / Mgmt
−$365
Net cashflow
$45/mo
Annual
$536/yr
Cap rate
6.54%
Cash-on-cash
0.89%
DSCR
1.04
1% rule
0.81%
Cash to close
$60,200
Investor read
- This is a 3-bed/2.0-bath manufactured listed at $215k.
- At list price, monthly cash flow is $45 ($536/yr) — positive.
- The deal already cash-flows at list — no discount required.
- To meet the 1% rule (rent ≥ 1% of price), the offer needs to be $174k (19.1% below list).
- Only 12 days on market — expect competitive offers; lowballing is unlikely to land.
- Recommended offer: $174k (19.1% below list) — sets the bar for 1% rule.
- In year one you build about $18k of equity ($1k loan paydown + $17k appreciation (7.7% local appreciation)).
- Location reads: area grade D — affects rentability + tenant quality, not the cash-flow math above.
- Osceola (suburban): math 39% / reading 45% proficiency, ranked #60 of 73 in FL (top 82%) — families likely to look elsewhere, expect single-tenant / working-renter base with shorter leases; 60% free/reduced lunch — lower-income household profile, screen leases tightly.
- Zoned schools: Harmony Community School (math 70% / reading 64%, grade B+, #450 of 2,144 statewide, top 22%, 1,012 students, 38% FRL); Harmony High School (math 40% / reading 46%, grade F, #255 of 667 statewide, top 39%, 2,822 students, 42% FRL) — zoned schools average 40% FRL vs 60% district-wide (20 pts lower); this property's tenant base skews higher-income than the district average.
- Zoned-school proficiency averages 55% at this address vs 42% district-wide (+13 pts) — the actual schools serving this property are materially stronger than the Osceola average implies; a family-tenant draw the district grade alone would hide.
- Market conditions: 26 active listings in the ZIP; 8,813 units permitted in Osceola County in 2024 (3,072 in 5+ unit buildings).
- Osceola County population projected at +73% by 2050 — long-run rental-demand tailwind backs the buy-and-hold thesis.
- 2 sale attempts with the ask held roughly flat each time — persistent listings suggest the price (not the market) is what's stuck; bring a comps-based counter.
- Current owner paid $26k; list at $215k implies a 727% gain — meaningful room to come down on a strong offer.
- At projected returns (7.7% appreciation + 3.0% rent growth), your $60k cash investment doubles in ~3 years — after that, you're playing with house money.
- By year 3, paydown + projected appreciation supports a ~$45k cash-out refi (75% LTV) — recoverable capital for the next deal without selling this one.
- Climate carrying-cost: severe wind risk, 99% chance of damaging wind over 30y; major wildfire risk; extreme-heat days projected 7→23/yr by 2055 (HVAC capex compounding) — expect insurance premiums to compound above CPI over the hold.
Questions for listing agent
- Is there a deadline driving the sale (1031 exchange, divorce, estate, relocation)? That informs how much negotiation room exists.
- The area grade is low — what's the realistic commute time and amenity access for the typical tenant pool here? Any planned neighborhood developments (good or bad) we should know about?
- What's the average days-on-market for RENTAL listings here right now (not sales)? A rising rental-DOM trend means longer vacancies and softer asking-rent achievability than the comps imply.
- What's the recent tenant-quality profile in this submarket — average credit score on applications, eviction rate, late-payment / NSF rate, and stable-employment percentage? A property-management company in the area should have these aggregated.
- How much new for-sale + rental construction is in the pipeline within 1–3 miles? Heavy new supply typically softens prices + rents 12–24 months out; constrained supply supports both.
CashFlowRE · CFR-TPKBAS78MDT54S
· Data 3 weeks ago
cashflowre.app · 2026-05-29