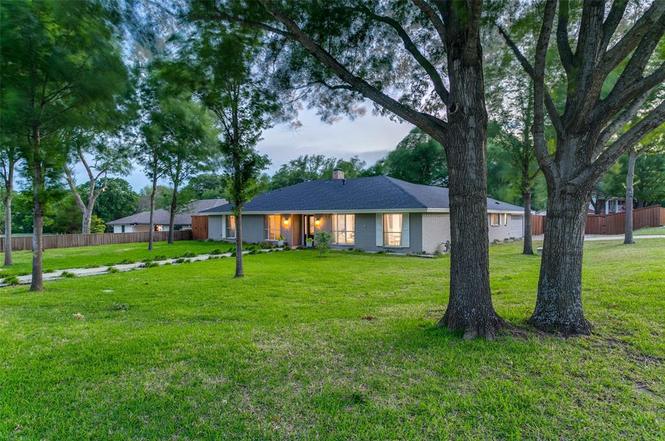
1210 Oakwood Trl
Southlake, TX 76092
$850,000D-
3 bd · 2.0 ba ·
2,676 sqft ·
Built 1977
· SingleFamily
· Active
· 21 DOM
Cashflow @ list (25.0% down · 7.5%)
Estimated rent
$6,564/mo
Mortgage (P&I)
−$4,457
Tax + insurance
−$1,282
HOA
−$0
Vac / Maint / Mgmt
−$1,378
Net cashflow
$-554/mo
Annual
$-6,647/yr
Cap rate
5.51%
Cash-on-cash
-2.79%
DSCR
0.88
1% rule
0.77%
Cash to close
$238,000
Investor read
- This is a 3-bed/2.0-bath single-family listed at $850k.
- At list price, monthly cash flow is $-554 ($-7k/yr) — negative.
- To cash-flow at today's rent, offer at most $752k (11.5% below list).
- To meet the 1% rule (rent ≥ 1% of price), the offer needs to be $656k (22.8% below list).
- It's been on market 21 days — a 2% lower offer ($837k) is reasonable based on typical stale-listing flexibility.
- Recommended offer: $656k (22.8% below list) — sets the bar for 1% rule.
- Local home prices are declining (-3.0%/yr); year-one equity from $6k of loan paydown is wiped out by about $26k of value loss. Plan a longer hold.
- Location reads 76/100 on livability (#107 in TX, #3,547 nationally) — a middle-class / working-renter tenant base. Strengths: crime A+, employment A+, housing A+; Watch: amenities F, commute F, cost of living F.
- Carroll ISD (suburban): math 84% / reading 83% proficiency, ranked #1 of 826 in TX (top 0%) — strong family-tenant draw, lease renewals of 3-5y typical; only 3% free/reduced lunch — higher-income household profile.
- Zoned schools: Carroll El (math 83% / reading 78%, grade A+, #28 of 4,322 statewide, top 1%, 625 students, 0% FRL) — zoned schools at 0% FRL track the district average.
- Market conditions: 283 active listings in the ZIP; 7 comparable units currently listed for rent nearby; rentals leasing fast (median 8d on market — plan ~1-2 weeks tenant-placement turnaround); high-income renter base; 18,938 units permitted in Tarrant County in 2024 (8,336 in 5+ unit buildings).
- Tarrant County population projected at +41% by 2050 — long-run rental-demand tailwind backs the buy-and-hold thesis.
- 5 sale attempts since 4y ago with the ask held roughly flat each time — persistent listings suggest the price (not the market) is what's stuck; bring a comps-based counter.
- Climate carrying-cost: extreme-heat days projected 7→23/yr by 2055 (HVAC capex compounding) — expect insurance premiums to compound above CPI over the hold.
- Cap rate 5.5% vs local median 1.5% in Southlake — top-decile yield for the area; either an underpriced asset or a hidden risk that comps aren't pricing in. Stress-test before assuming the spread holds.
- This rent runs 32% of the median local income ($250k/yr) — at the standard rent-burdened threshold; future hikes will face affordability resistance.
Questions for listing agent
- What do current leases actually rent for vs. the listed asking? Can we see a recent rent roll and the last 12 months of T-12 income?
- Built in 1977 — when were the roof, HVAC, electrical panel, plumbing, and water heater last replaced?
- Is there a deadline driving the sale (1031 exchange, divorce, estate, relocation)? That informs how much negotiation room exists.
- Schools are A-rated — typically a magnet for longer-tenancy family renters. What's the average tenant stay here, and is there a school-zone premium baked into asking?
- The area grade is low — what's the realistic commute time and amenity access for the typical tenant pool here? Any planned neighborhood developments (good or bad) we should know about?
- What's the average days-on-market for RENTAL listings here right now (not sales)? A rising rental-DOM trend means longer vacancies and softer asking-rent achievability than the comps imply.
- What's the recent tenant-quality profile in this submarket — average credit score on applications, eviction rate, late-payment / NSF rate, and stable-employment percentage? A property-management company in the area should have these aggregated.
- How much new for-sale + rental construction is in the pipeline within 1–3 miles? Heavy new supply typically softens prices + rents 12–24 months out; constrained supply supports both.
CashFlowRE · CFR-TPRSMMDQZXT1YW
· Data 2 days ago
cashflowre.app · 2026-05-29