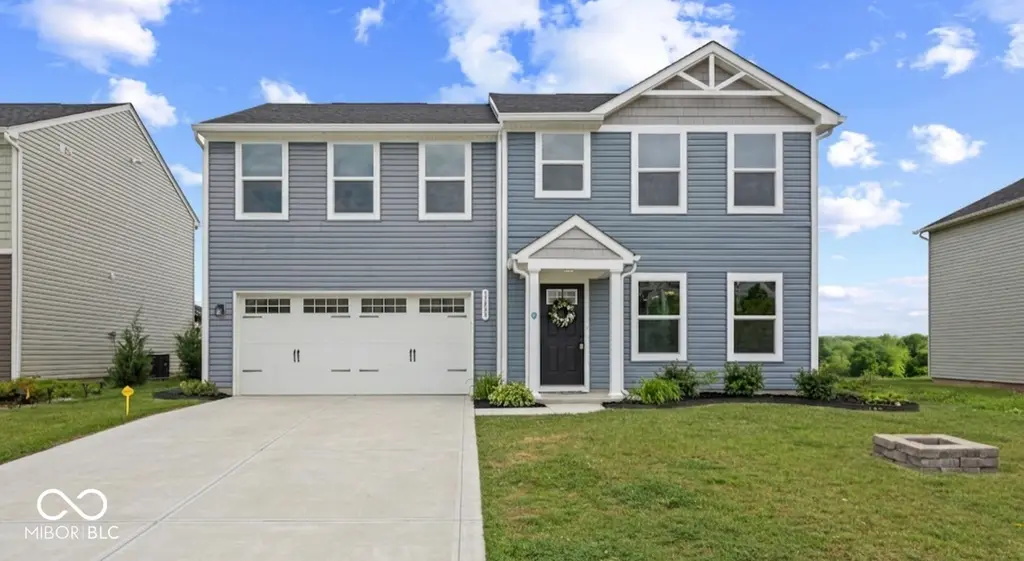
13841 N Cardonia Dr
Indianapolis city (balance), IN 46113
$315,000D-
4 bd · 2.5 ba ·
1,920 sqft ·
Built 2019
· SingleFamily
· Active
· 2 DOM
Cashflow @ list (25.0% down · 7.5%)
Estimated rent
$2,487/mo
Mortgage (P&I)
−$1,652
Tax + insurance
−$242
HOA
−$33
Vac / Maint / Mgmt
−$522
Net cashflow
$37/mo
Annual
$449/yr
Cap rate
6.44%
Cash-on-cash
0.51%
DSCR
1.02
1% rule
0.79%
Cash to close
$88,200
Investor read
- This is a 4-bed/2.5-bath single-family listed at $315k.
- At list price, monthly cash flow is $37 ($449/yr) — positive.
- The deal already cash-flows at list — no discount required.
- To meet the 1% rule (rent ≥ 1% of price), the offer needs to be $249k (21.0% below list).
- Only 2 days on market — expect competitive offers; lowballing is unlikely to land.
- Recommended offer: $249k (21.0% below list) — sets the bar for 1% rule.
- Local home prices are declining (-3.0%/yr); year-one equity from $2k of loan paydown is wiped out by about $9k of value loss. Plan a longer hold.
- Location reads: area grade D — affects rentability + tenant quality, not the cash-flow math above.
- Mooresville Consolidated School Corporation (suburban): math 41% / reading 43% proficiency, ranked #111 of 301 in IN (top 37%) — families likely to look elsewhere, expect single-tenant / working-renter base with shorter leases.
- Zoned schools: North Madison Elementary School (math 48% / reading 33%, grade F, #491 of 994 statewide, top 50%, 632 students, 46% FRL); Paul Hadley Middle School (math 31% / reading 38%, grade F, #167 of 330 statewide, top 52%, 687 students, 47% FRL); Mooresville High School (math 43% / reading 74%, grade C, #60 of 369 statewide, top 16%, 1,404 students, 39% FRL).
- Market conditions: Rents rising (+2.9%/yr); 67 active listings in the ZIP; 6 comparable units currently listed for rent nearby; rentals at typical pace (median 18d on market — plan ~3-4 weeks tenant-placement turnaround); solid renter incomes; 330 units permitted in Morgan County in 2024 (0 in 5+ unit buildings).
- Morgan County population projected to shrink 6% by 2050 — rents likely to lag national; underwrite the cash flow, not the appreciation.
- 5 sale attempts since 7y ago with the ask held roughly flat each time — persistent listings suggest the price (not the market) is what's stuck; bring a comps-based counter.
- Current owner paid $105k; list at $315k implies a 200% gain — meaningful room to come down on a strong offer.
- Cap rate 6.4% vs local median 4.4% in Indianapolis city (balance) — top-decile yield for the area; either an underpriced asset or a hidden risk that comps aren't pricing in. Stress-test before assuming the spread holds.
- This rent runs 35% of the median local income ($84k/yr) — at the standard rent-burdened threshold; future hikes will face affordability resistance.
Questions for listing agent
- What does the HOA fee cover, when was the last increase, and are there any pending special assessments or reserve-fund shortfalls?
- Is there a deadline driving the sale (1031 exchange, divorce, estate, relocation)? That informs how much negotiation room exists.
- The area grade is low — what's the realistic commute time and amenity access for the typical tenant pool here? Any planned neighborhood developments (good or bad) we should know about?
- What's the average days-on-market for RENTAL listings here right now (not sales)? A rising rental-DOM trend means longer vacancies and softer asking-rent achievability than the comps imply.
- What's the recent tenant-quality profile in this submarket — average credit score on applications, eviction rate, late-payment / NSF rate, and stable-employment percentage? A property-management company in the area should have these aggregated.
- How much new for-sale + rental construction is in the pipeline within 1–3 miles? Heavy new supply typically softens prices + rents 12–24 months out; constrained supply supports both.
CashFlowRE · CFR-TRXCC792CV939P
· Data 1 day ago
cashflowre.app · 2026-05-29