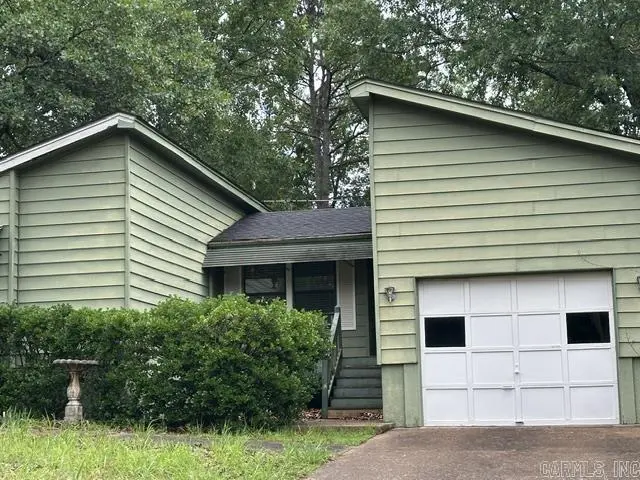
129 Dunn Hollow Dr
Fairfield Bay, AR 72088
$80,000A-
2 bd · 2.0 ba ·
1,369 sqft ·
Built 1975
· SingleFamily
· Active
· 30 DOM
Cashflow @ list (25.0% down · 7.5%)
Estimated rent
$2,000/mo
Mortgage (P&I)
−$420
Tax + insurance
−$133
HOA
−$218
Vac / Maint / Mgmt
−$420
Net cashflow
$809/mo
Annual
$9,710/yr
Cap rate
18.43%
Cash-on-cash
43.35%
DSCR
2.93
1% rule
2.50%
Cash to close
$22,400
Investor read
- This is a 2-bed/2.0-bath single-family listed at $80k.
- At list price, monthly cash flow is $809 ($10k/yr) — positive.
- The deal already cash-flows at list — no discount required.
- Meets the 1% rule at list price ($2k rent vs $80k).
- It's been on market 30 days — a 2% lower offer ($79k) is reasonable based on typical stale-listing flexibility.
- Recommended offer: $79k (1.5% below list) — sets the bar for market timing.
- In year one you build about $172 of equity ($553 loan paydown + $-381 appreciation (-0.5% local appreciation)).
- Location reads 62/100 on livability (#220 in AR) — a middle-class / working-renter tenant base. Strengths: cost of living A+, housing A+, crime B; Watch: employment D+, schools F, amenities F.
- Shirley School District (rural): math 44% / reading 42% proficiency, ranked #132 of 245 in AR (top 54%) — families likely to look elsewhere, expect single-tenant / working-renter base with shorter leases; 73% free/reduced lunch — lower-income household profile, screen leases tightly.
- Market conditions: 259 active listings in the ZIP; 1 comparable units currently listed for rent nearby; 16 units permitted in Van Buren County in 2024 (0 in 5+ unit buildings).
- Van Buren County population projected at -27% by 2050 — secular population decline; favor cash flow + early exit over multi-decade hold.
- 5 sale attempts since 13y ago with the ask held roughly flat each time — persistent listings suggest the price (not the market) is what's stuck; bring a comps-based counter.
- Current owner paid $48k; list at $80k implies a 67% gain — meaningful room to come down on a strong offer.
- At projected returns (-0.5% appreciation + 3.0% rent growth), your $22k cash investment doubles in ~3 years — after that, you're playing with house money.
- Climate carrying-cost: extreme-heat days projected 6→17/yr by 2055 (HVAC capex compounding) — expect insurance premiums to compound above CPI over the hold.
- Cap rate 18.4% vs local median 5.3% in Fairfield Bay — top-decile yield for the area; either an underpriced asset or a hidden risk that comps aren't pricing in. Stress-test before assuming the spread holds.
Questions for listing agent
- Built in 1975 — when were the roof, HVAC, electrical panel, plumbing, and water heater last replaced?
- What does the HOA fee cover, when was the last increase, and are there any pending special assessments or reserve-fund shortfalls?
- Is there a deadline driving the sale (1031 exchange, divorce, estate, relocation)? That informs how much negotiation room exists.
- Schools are F-rated, which usually means shorter tenancies and higher turnover. Who's the typical renter profile here, and what's been the actual vacancy rate?
- What's the average days-on-market for RENTAL listings here right now (not sales)? A rising rental-DOM trend means longer vacancies and softer asking-rent achievability than the comps imply.
- What's the recent tenant-quality profile in this submarket — average credit score on applications, eviction rate, late-payment / NSF rate, and stable-employment percentage? A property-management company in the area should have these aggregated.
- How much new for-sale + rental construction is in the pipeline within 1–3 miles? Heavy new supply typically softens prices + rents 12–24 months out; constrained supply supports both.
CashFlowRE · CFR-TSHAB1D0SX6CSZ
· Data 1 day ago
cashflowre.app · 2026-05-29