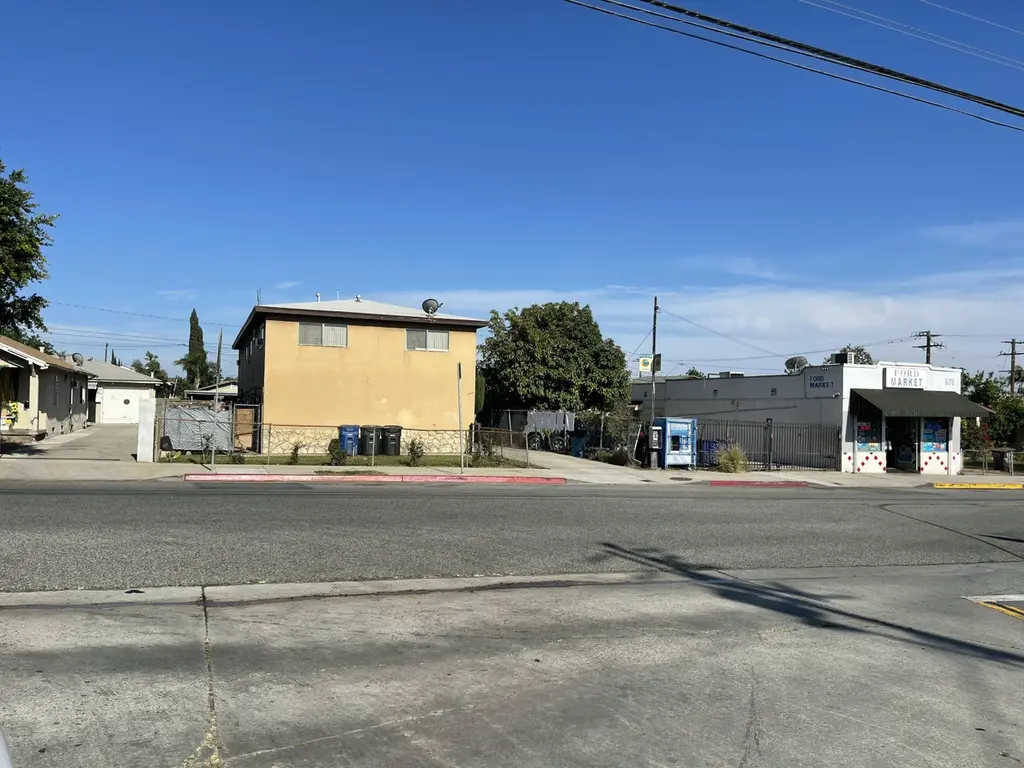
664 S Ford Blvd
East Los Angeles, CA 90022
$1,050,000D
8 bd · 8.0 ba ·
3,744 sqft ·
Built 1971
· MultiFamily
· Active
· 11 DOM
Cashflow @ list (25.0% down · 7.5%)
Estimated rent
$9,903/mo
Mortgage (P&I)
−$5,506
Tax + insurance
−$807
HOA
−$0
Vac / Maint / Mgmt
−$2,080
Net cashflow
$1,510/mo
Annual
$18,115/yr
Cap rate
8.02%
Cash-on-cash
6.16%
DSCR
1.27
1% rule
0.94%
Cash to close
$294,000
Investor read
- This is a 4 × 2-bed/2.0-bath units multifamily listed at $1.05M.
- At list price, monthly cash flow is $2k ($18k/yr) — positive. Per door: $377/mo.
- The deal already cash-flows at list — no discount required.
- To meet the 1% rule (rent ≥ 1% of price), the offer needs to be $990k (5.7% below list).
- Only 11 days on market — expect competitive offers; lowballing is unlikely to land.
- Recommended offer: $990k (5.7% below list) — sets the bar for 1% rule.
- Local home prices are declining (-3.0%/yr); year-one equity from $7k of loan paydown is wiped out by about $32k of value loss. Plan a longer hold.
- Location reads 60/100 on livability (#594 in CA) — a middle-class / working-renter tenant base. Strengths: commute A+; Watch: employment C-, health & safety D, crime F.
- Los Angeles Unified (urban): math 29% / reading 54% proficiency, ranked #223 of 517 in CA (top 43%) — families likely to look elsewhere, expect single-tenant / working-renter base with shorter leases; 67% free/reduced lunch — lower-income household profile, screen leases tightly.
- Zoned schools: Humphreys Avenue Elementary (408 students, 95% FRL); Griffith Middle (1,189 students, 93% FRL); James A. Garfield Senior High (math 32% / reading 59%, grade D-, #417 of 1,170 statewide, top 36%, 2,247 students, 96% FRL) — zoned schools average 95% FRL vs 67% district-wide (27 pts higher); higher-poverty schools than district average — tighter screening recommended.
- Market conditions: Rents falling (-7.0%/yr); 55 active listings in the ZIP; 19,697 units permitted in Los Angeles County in 2024 (9,426 in 5+ unit buildings).
- Los Angeles County population projected at +9% by 2050 — modest demand growth; plan on rents tracking national, not racing it.
- Climate carrying-cost: extreme-heat days projected 7→21/yr by 2055 (HVAC capex compounding) — expect insurance premiums to compound above CPI over the hold.
- Cap rate 8.0% vs local median 3.5% in East Los Angeles — top-decile yield for the area; either an underpriced asset or a hidden risk that comps aren't pricing in. Stress-test before assuming the spread holds.
- At $9,903/mo this rent would consume 175% of the median local household income ($68k/yr) (locally 2612% of renters already pay >50% of income on rent) — very limited rent-growth headroom before tenants either downsize or default.
Questions for listing agent
- Can we see the unit-by-unit rent roll, current vacancy, and any below-market leases? What's the average tenancy length?
- What capital expenditures (roof, boiler, parking lot, exteriors) have been made in the last 5 years, and what's planned in the next 2?
- Built in 1971 — when were the roof, HVAC, electrical panel, plumbing, and water heater last replaced?
- Is there a deadline driving the sale (1031 exchange, divorce, estate, relocation)? That informs how much negotiation room exists.
- Schools are B-rated — typically a magnet for longer-tenancy family renters. What's the average tenant stay here, and is there a school-zone premium baked into asking?
- Crime grade is F in this area — have there been break-ins, vandalism, or insurance claims at this property in the last 3 years? What carrier currently insures it and at what premium?
- The area grade is low — what's the realistic commute time and amenity access for the typical tenant pool here? Any planned neighborhood developments (good or bad) we should know about?
- What's the average days-on-market for RENTAL listings here right now (not sales)? A rising rental-DOM trend means longer vacancies and softer asking-rent achievability than the comps imply.
CashFlowRE · CFR-TV0SSM6W37ZBBV
· Data 15 h ago
cashflowre.app · 2026-05-29