3030 S Heritage Dr
West Valley City, UT 84119
$39,000C
2 bd · 1.5 ba ·
840 sqft ·
Built 1971
· Manufactured
· Active
· 44 DOM
Cashflow @ list (25.0% down · 7.5%)
Estimated rent
$1,500/mo
Mortgage (P&I)
−$205
Tax + insurance
−$65
HOA
−$855
Vac / Maint / Mgmt
−$315
Net cashflow
$60/mo
Annual
$722/yr
Cap rate
8.14%
Cash-on-cash
6.61%
DSCR
1.29
1% rule
3.85%
Cash to close
$10,920
Investor read
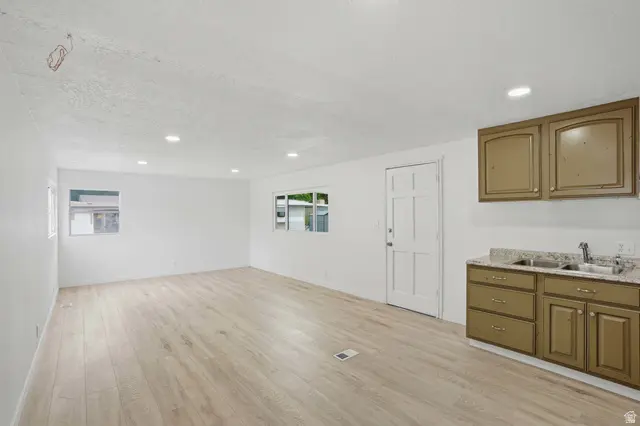
- This is a 2-bed/1.5-bath manufactured listed at $39k.
- At list price, monthly cash flow is $60 ($722/yr) — positive.
- The deal already cash-flows at list — no discount required.
- Meets the 1% rule at list price ($2k rent vs $39k).
- It's been on market 44 days — a 3% lower offer ($38k) is reasonable based on typical stale-listing flexibility.
- Recommended offer: $38k (3.0% below list) — sets the bar for market timing.
- Local home prices are declining (-3.0%/yr); year-one equity from $270 of loan paydown is wiped out by about $1k of value loss. Plan a longer hold.
- Location reads 76/100 on livability (#55 in UT, #3,285 nationally) — a middle-class / working-renter tenant base. Strengths: commute A+, housing A+, employment A-; Watch: crime D-, amenities F, health & safety D-.
- Granite District (suburban): math 26% / reading 32% proficiency, ranked #69 of 80 in UT (top 86%) — low school quality limits family demand, transient renter base, plan for 1-2y turnover.
- Zoned schools: Stansbury School (math 12% / reading 17%, grade F, #559 of 585 statewide, top 96%, 623 students, 82% FRL); Granite Park Jr High (math 6% / reading 14%, grade F, #138 of 138 statewide, top 100%, 871 students, 70% FRL); Granger High (math 7% / reading 22%, grade F, #167 of 171 statewide, top 98%, 3,481 students, 63% FRL) — zoned schools average 71% FRL vs 45% district-wide (26 pts higher); higher-poverty schools than district average — tighter screening recommended.
- Zoned-school proficiency averages 13% at this address vs 29% district-wide (-16 pts) — the specific schools serving this property underperform the Granite District average; the district grade overstates school quality for this exact location.
- Watch-outs: HOA is 57% of rent.
- Market conditions: Rents flat; 232 active listings in the ZIP; 24 comparable units currently listed for rent nearby; rentals at typical pace (median 16d on market — plan ~3-4 weeks tenant-placement turnaround); 4,970 units permitted in Salt Lake County in 2024 (1,963 in 5+ unit buildings).
- Salt Lake County population projected at +37% by 2050 — long-run rental-demand tailwind backs the buy-and-hold thesis.
- 2 sale attempts since 29y ago with the ask held roughly flat each time — persistent listings suggest the price (not the market) is what's stuck; bring a comps-based counter.
Questions for listing agent
- It's been on market 44 days. Have you received any prior offers? Is the seller open to a 3% concession, seller financing, or rate buy-down credit?
- Built in 1971 — when were the roof, HVAC, electrical panel, plumbing, and water heater last replaced?
- What does the HOA fee cover, when was the last increase, and are there any pending special assessments or reserve-fund shortfalls?
- Is there a deadline driving the sale (1031 exchange, divorce, estate, relocation)? That informs how much negotiation room exists.
- Schools are F-rated, which usually means shorter tenancies and higher turnover. Who's the typical renter profile here, and what's been the actual vacancy rate?
- Crime grade is D in this area — have there been break-ins, vandalism, or insurance claims at this property in the last 3 years? What carrier currently insures it and at what premium?
- What's the average days-on-market for RENTAL listings here right now (not sales)? A rising rental-DOM trend means longer vacancies and softer asking-rent achievability than the comps imply.
- What's the recent tenant-quality profile in this submarket — average credit score on applications, eviction rate, late-payment / NSF rate, and stable-employment percentage? A property-management company in the area should have these aggregated.
CashFlowRE · CFR-TVZT18BESDEG4E
· Data 21 h ago
cashflowre.app · 2026-05-29