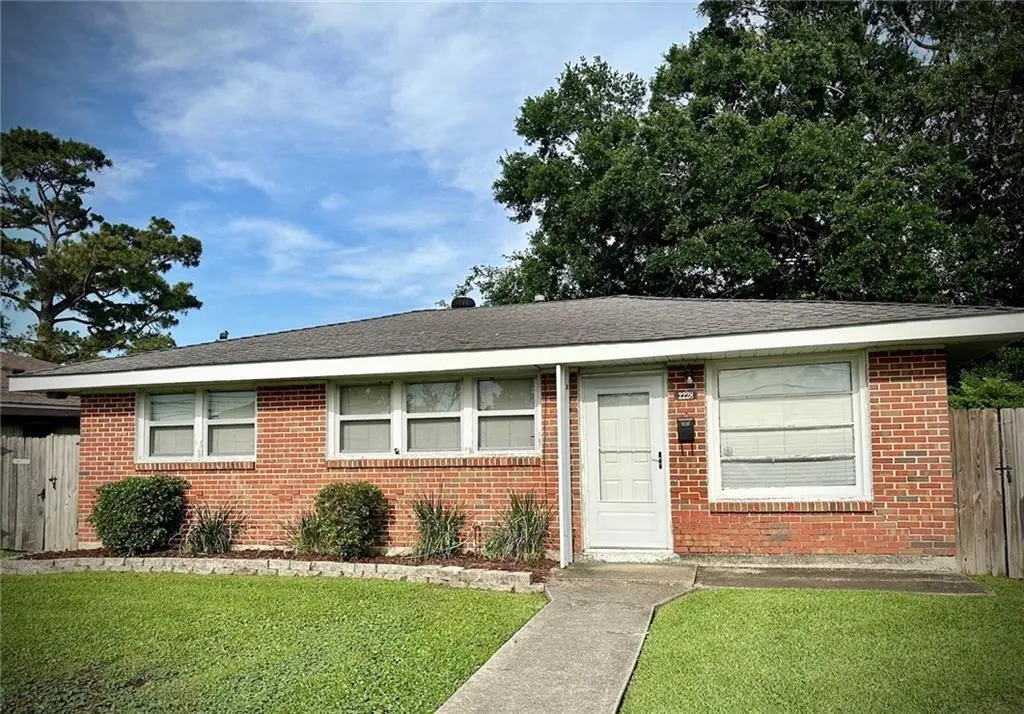
2228 Kentucky Ave
Kenner, LA 70062
$170,000C+
3 bd · 1.0 ba ·
1,150 sqft ·
Built 1975
· SingleFamily
· Active
· 164 DOM
Cashflow @ list (25.0% down · 7.5%)
Estimated rent
$1,741/mo
Mortgage (P&I)
−$891
Tax + insurance
−$159
HOA
−$0
Vac / Maint / Mgmt
−$366
Net cashflow
$325/mo
Annual
$3,900/yr
Cap rate
8.59%
Cash-on-cash
8.19%
DSCR
1.36
1% rule
1.02%
Cash to close
$47,600
Investor read
- This is a 3-bed/1.0-bath single-family listed at $170k.
- At list price, monthly cash flow is $325 ($4k/yr) — positive.
- The deal already cash-flows at list — no discount required.
- Meets the 1% rule at list price ($2k rent vs $170k).
- It's been on market 164 days — a 12% lower offer ($150k) is reasonable based on typical stale-listing flexibility.
- Recommended offer: $150k (12.0% below list) — sets the bar for market timing.
- Local home prices are declining (-3.0%/yr); year-one equity from $1k of loan paydown is wiped out by about $5k of value loss. Plan a longer hold.
- Location reads 78/100 on livability (#6 in LA, #2,414 nationally) — a middle-class / working-renter tenant base. Strengths: cost of living A+, housing A+, health & safety A+; Watch: amenities C-, employment C-, crime D.
- Jefferson Parish (suburban): math 24% / reading 34% proficiency, ranked #44 of 98 in LA (top 45%) — low school quality limits family demand, transient renter base, plan for 1-2y turnover; 70% free/reduced lunch — lower-income household profile, screen leases tightly.
- Zoned schools: John Clancy/Joseph Maggiore Elementary School (math 10% / reading 26%, grade F, #472 of 646 statewide, top 74%, 547 students, 57% FRL); T.H. Harris Middle School (math 8% / reading 24%, grade F, #180 of 218 statewide, top 83%, 707 students, 61% FRL); East Jefferson High School (math 18% / reading 35%, grade F, #148 of 265 statewide, top 56%, 1,348 students, 55% FRL).
- Market conditions: 91 active listings in the ZIP; 40 comparable units currently listed for rent nearby; rentals at typical pace (median 25d on market — plan ~3-4 weeks tenant-placement turnaround); 518 units permitted in Jefferson Parish in 2024 (43 in 5+ unit buildings).
- 3 sale attempts; this cycle's ask has dropped $15k (8%) from the opening price — seller is motivated, your offer sets the floor, not the list.
- Current owner paid $87k; list at $170k implies a 95% gain — meaningful room to come down on a strong offer.
- Cap rate 8.6% vs local median 5.3% in Kenner — top-decile yield for the area; either an underpriced asset or a hidden risk that comps aren't pricing in. Stress-test before assuming the spread holds.
- This rent runs 41% of the median local income ($51k/yr) — at the standard rent-burdened threshold; future hikes will face affordability resistance.
Questions for listing agent
- It's been on market 164 days. Have you received any prior offers? Is the seller open to a 12% concession, seller financing, or rate buy-down credit?
- Built in 1975 — when were the roof, HVAC, electrical panel, plumbing, and water heater last replaced?
- Why hasn't it sold? Are there any deal-killer items the seller is aware of (foundation, flood, title, zoning, code violations)?
- Is there a deadline driving the sale (1031 exchange, divorce, estate, relocation)? That informs how much negotiation room exists.
- Crime grade is D in this area — have there been break-ins, vandalism, or insurance claims at this property in the last 3 years? What carrier currently insures it and at what premium?
- What's the average days-on-market for RENTAL listings here right now (not sales)? A rising rental-DOM trend means longer vacancies and softer asking-rent achievability than the comps imply.
- What's the recent tenant-quality profile in this submarket — average credit score on applications, eviction rate, late-payment / NSF rate, and stable-employment percentage? A property-management company in the area should have these aggregated.
- How much new for-sale + rental construction is in the pipeline within 1–3 miles? Heavy new supply typically softens prices + rents 12–24 months out; constrained supply supports both.
CashFlowRE · CFR-TW222N6R24SYXE
· Data 13 h ago
cashflowre.app · 2026-05-29