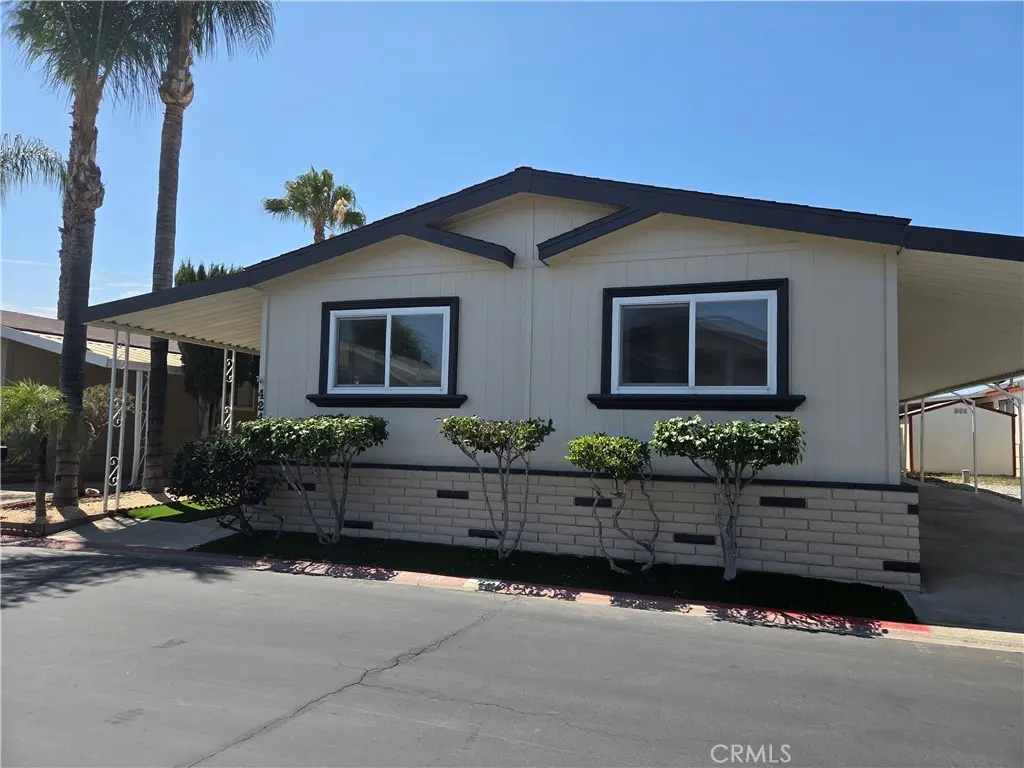
1456 E Philadelphia St Spc 424
Ontario, CA 91761
$189,999C+
3 bd · 2.0 ba ·
1,536 sqft ·
Built 1983
· Manufactured
· Coming Soon
· 6 DOM
Cashflow @ list (25.0% down · 7.5%)
Estimated rent
$3,405/mo
Mortgage (P&I)
−$996
Tax + insurance
−$317
HOA
−$0
Vac / Maint / Mgmt
−$715
Net cashflow
$1,377/mo
Annual
$16,524/yr
Cap rate
14.99%
Cash-on-cash
31.06%
DSCR
2.38
1% rule
1.79%
Cash to close
$53,200
Investor read
- This is a 3-bed/2.0-bath manufactured listed at $190k.
- At list price, monthly cash flow is $1k ($17k/yr) — positive.
- The deal already cash-flows at list — no discount required.
- Meets the 1% rule at list price ($3k rent vs $190k).
- Only 6 days on market — expect competitive offers; lowballing is unlikely to land.
- Local home prices are declining (-3.0%/yr); year-one equity from $1k of loan paydown is wiped out by about $6k of value loss. Plan a longer hold.
- Location reads 63/100 on livability (#435 in CA) — a middle-class / working-renter tenant base. Strengths: commute A-, housing B+; Watch: schools F, cost of living F, health & safety F.
- Ontario-Montclair (urban): math 35% / reading 44% proficiency, ranked #731 of 1,400 in CA (top 52%) — families likely to look elsewhere, expect single-tenant / working-renter base with shorter leases; 75% free/reduced lunch — lower-income household profile, screen leases tightly.
- Market conditions: Rents rising (+2.4%/yr); 314 active listings in the ZIP; 9 comparable units currently listed for rent nearby; rentals leasing fast (median 2d on market — plan ~1-2 weeks tenant-placement turnaround); solid renter incomes; 5,458 units permitted in San Bernardino County in 2024 (1,500 in 5+ unit buildings).
- San Bernardino County population projected at +15% by 2050 — modest demand growth; plan on rents tracking national, not racing it.
- 5 sale attempts since 6y ago; this cycle's ask is 92% above the opening price — seller raised mid-cycle; expect resistance to lowballs.
- Current owner paid $80k; list at $190k implies a 137% gain — meaningful room to come down on a strong offer.
- At projected returns (-3.0% appreciation + 2.4% rent growth), your $53k cash investment doubles in ~4 years — after that, you're playing with house money.
- Climate carrying-cost: extreme-heat days projected 7→19/yr by 2055 (HVAC capex compounding) — expect insurance premiums to compound above CPI over the hold.
- Cap rate 15.0% vs local median 2.7% in Ontario — top-decile yield for the area; either an underpriced asset or a hidden risk that comps aren't pricing in. Stress-test before assuming the spread holds.
- This rent runs 41% of the median local income ($101k/yr) — at the standard rent-burdened threshold; future hikes will face affordability resistance.
Questions for listing agent
- Is there a deadline driving the sale (1031 exchange, divorce, estate, relocation)? That informs how much negotiation room exists.
- Schools are F-rated, which usually means shorter tenancies and higher turnover. Who's the typical renter profile here, and what's been the actual vacancy rate?
- What's the average days-on-market for RENTAL listings here right now (not sales)? A rising rental-DOM trend means longer vacancies and softer asking-rent achievability than the comps imply.
- What's the recent tenant-quality profile in this submarket — average credit score on applications, eviction rate, late-payment / NSF rate, and stable-employment percentage? A property-management company in the area should have these aggregated.
- How much new for-sale + rental construction is in the pipeline within 1–3 miles? Heavy new supply typically softens prices + rents 12–24 months out; constrained supply supports both.
CashFlowRE · CFR-TYCJ599CBZQYFV
· Data 2 days ago
cashflowre.app · 2026-05-29