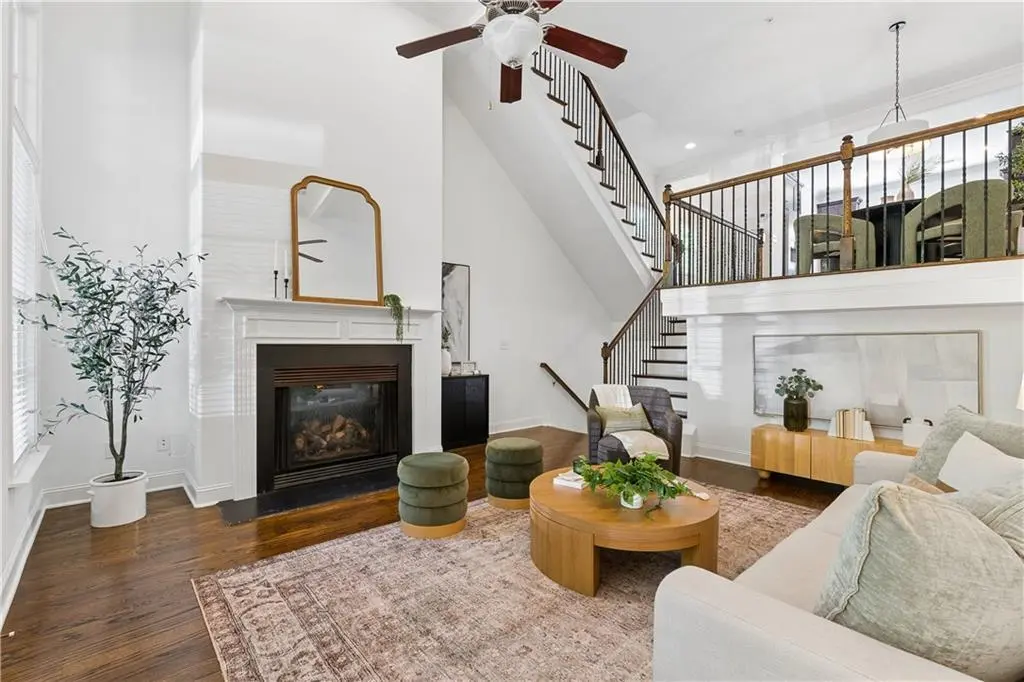
255 Southerland Ter NE #108
Atlanta, GA 30307
$599,000D
3 bd · 3.5 ba ·
2,274 sqft ·
Built 2011
· Townhouse
· Active
· 50 DOM
Cashflow @ list (25.0% down · 7.5%)
Estimated rent
$4,646/mo
Mortgage (P&I)
−$3,141
Tax + insurance
−$998
HOA
−$0
Vac / Maint / Mgmt
−$976
Net cashflow
$-469/mo
Annual
$-5,634/yr
Cap rate
5.35%
Cash-on-cash
-3.36%
DSCR
0.85
1% rule
0.78%
Cash to close
$167,720
Investor read
- This is a 3-bed/3.5-bath townhouse listed at $599k.
- At list price, monthly cash flow is $-469 ($-6k/yr) — negative.
- To cash-flow at today's rent, offer at most $531k (11.3% below list).
- To meet the 1% rule (rent ≥ 1% of price), the offer needs to be $465k (22.4% below list).
- It's been on market 50 days — a 3% lower offer ($581k) is reasonable based on typical stale-listing flexibility.
- Recommended offer: $465k (22.4% below list) — sets the bar for 1% rule.
- Local home prices are declining (-3.0%/yr); year-one equity from $4k of loan paydown is wiped out by about $18k of value loss. Plan a longer hold.
- Location reads 83/100 on livability (#6 in GA, #919 nationally) — a professional / high-income tenant draw. Strengths: amenities A+, commute A+, housing A+; Watch: cost of living C-.
- Atlanta Public Schools (urban): math 28% / reading 35% proficiency, ranked #80 of 174 in GA (top 46%) — families likely to look elsewhere, expect single-tenant / working-renter base with shorter leases; 71% free/reduced lunch — lower-income household profile, screen leases tightly.
- Zoned schools: Mary Lin Elementary School (math 69% / reading 68%, grade B+, #73 of 1,228 statewide, top 6%, 628 students, 5% FRL); David T Howard Middle School (math 58% / reading 63%, grade B+, #39 of 470 statewide, top 8%, 1,119 students, 19% FRL); Midtown High School (math 22% / reading 34%, grade F, #151 of 424 statewide, top 36%, 1,602 students, 19% FRL) — zoned schools average 14% FRL vs 71% district-wide (57 pts lower); this property's tenant base skews higher-income than the district average.
- Zoned-school proficiency averages 52% at this address vs 32% district-wide (+21 pts) — the actual schools serving this property are materially stronger than the Atlanta Public Schools average implies; a family-tenant draw the district grade alone would hide.
- Market conditions: Rents rising (+1.8%/yr); 170 active listings in the ZIP; 27 comparable units currently listed for rent nearby; rentals at typical pace (median 18d on market — plan ~3-4 weeks tenant-placement turnaround); high-income renter base; 1,240 units permitted in DeKalb County in 2024 (385 in 5+ unit buildings).
- DeKalb County population projected at +28% by 2050 — long-run rental-demand tailwind backs the buy-and-hold thesis.
- 15 sale attempts since 14y ago with the ask held roughly flat each time — persistent listings suggest the price (not the market) is what's stuck; bring a comps-based counter.
- Current owner paid $348k; list at $599k implies a 72% gain — meaningful room to come down on a strong offer.
- Climate carrying-cost: moderate wind risk, 26% chance of damaging wind over 30y; extreme-heat days projected 7→18/yr by 2055 (HVAC capex compounding) — expect insurance premiums to compound above CPI over the hold.
- Cap rate 5.4% vs local median 3.1% in Atlanta — top-decile yield for the area; either an underpriced asset or a hidden risk that comps aren't pricing in. Stress-test before assuming the spread holds.
- This rent runs 40% of the median local income ($141k/yr) — at the standard rent-burdened threshold; future hikes will face affordability resistance.
Questions for listing agent
- What do current leases actually rent for vs. the listed asking? Can we see a recent rent roll and the last 12 months of T-12 income?
- It's been on market 50 days. Have you received any prior offers? Is the seller open to a 22% concession, seller financing, or rate buy-down credit?
- Is there a deadline driving the sale (1031 exchange, divorce, estate, relocation)? That informs how much negotiation room exists.
- The area grade is low — what's the realistic commute time and amenity access for the typical tenant pool here? Any planned neighborhood developments (good or bad) we should know about?
- What's the average days-on-market for RENTAL listings here right now (not sales)? A rising rental-DOM trend means longer vacancies and softer asking-rent achievability than the comps imply.
- What's the recent tenant-quality profile in this submarket — average credit score on applications, eviction rate, late-payment / NSF rate, and stable-employment percentage? A property-management company in the area should have these aggregated.
- How much new for-sale + rental construction is in the pipeline within 1–3 miles? Heavy new supply typically softens prices + rents 12–24 months out; constrained supply supports both.
CashFlowRE · CFR-TYTYH6CGW9A743
· Data 2 days ago
cashflowre.app · 2026-05-29