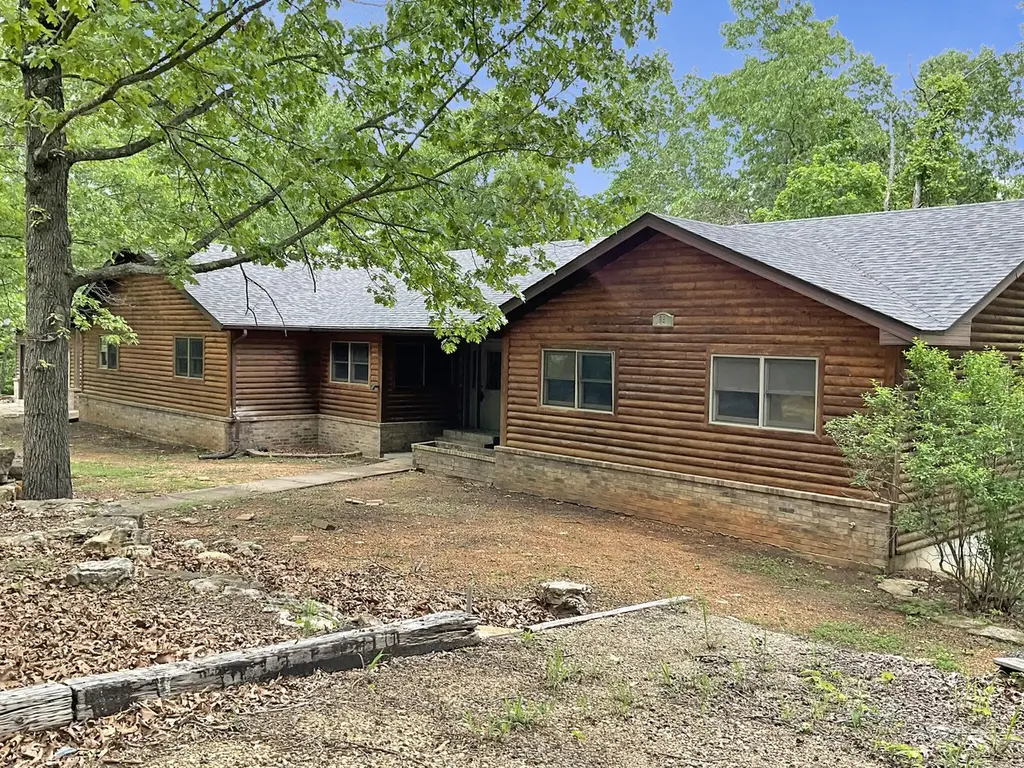
98 Fine Dr
Kimberling City, MO 65656
$216,900D-
4 bd · 2.5 ba ·
3,114 sqft ·
Built 1999
· Other
· Active
· 6 DOM
Cashflow @ list (25.0% down · 7.5%)
Estimated rent
$1,409/mo
Mortgage (P&I)
−$1,137
Tax + insurance
−$248
HOA
−$0
Vac / Maint / Mgmt
−$296
Net cashflow
$-272/mo
Annual
$-3,264/yr
Cap rate
4.79%
Cash-on-cash
-5.37%
DSCR
0.76
1% rule
0.65%
Cash to close
$60,732
Investor read
- This is a 4-bed/2.5-bath other listed at $217k.
- At list price, monthly cash flow is $-272 ($-3k/yr) — negative.
- To cash-flow at today's rent, offer at most $169k (22.2% below list).
- To meet the 1% rule (rent ≥ 1% of price), the offer needs to be $141k (35.0% below list).
- Only 6 days on market — expect competitive offers; lowballing is unlikely to land.
- Recommended offer: $141k (35.0% below list) — sets the bar for 1% rule.
- In year one you build about $23k of equity ($2k loan paydown + $22k appreciation (10.0% local appreciation)).
- Location reads 69/100 on livability (#162 in MO) — a middle-class / working-renter tenant base. Strengths: crime A+, cost of living A+, housing A+; Watch: health & safety C-, employment D, amenities F.
- Reeds Spring R-IV (rural): math 34% / reading 42% proficiency, ranked #182 of 324 in MO (top 56%) — families likely to look elsewhere, expect single-tenant / working-renter base with shorter leases.
- Zoned schools: Reeds Spring Elem. (math 33% / reading 33%, grade F, #744 of 1,115 statewide, top 67%, 358 students, 62% FRL); Reeds Spring Middle (math 31% / reading 46%, grade F, #202 of 391 statewide, top 54%, 286 students, 56% FRL); Reeds Spring High (math 32% / reading 47%, grade F, #247 of 521 statewide, top 55%, 602 students, 47% FRL) — zoned schools at 55% FRL track the district average.
- Market conditions: 119 active listings in the ZIP; 191 units permitted in Stone County in 2024 (0 in 5+ unit buildings).
- Stone County population projected at -30% by 2050 — secular population decline; favor cash flow + early exit over multi-decade hold.
- 2 sale attempts with the ask held roughly flat each time — persistent listings suggest the price (not the market) is what's stuck; bring a comps-based counter.
- Current owner paid $11k; list at $217k implies a 1918% gain — meaningful room to come down on a strong offer.
- By year 2, paydown + projected appreciation supports a ~$37k cash-out refi (75% LTV) — recoverable capital for the next deal without selling this one.
- Cap rate 4.8% vs local median 1.7% in Kimberling City — top-decile yield for the area; either an underpriced asset or a hidden risk that comps aren't pricing in. Stress-test before assuming the spread holds.
Questions for listing agent
- What do current leases actually rent for vs. the listed asking? Can we see a recent rent roll and the last 12 months of T-12 income?
- Is there a deadline driving the sale (1031 exchange, divorce, estate, relocation)? That informs how much negotiation room exists.
- Schools are D-rated, which usually means shorter tenancies and higher turnover. Who's the typical renter profile here, and what's been the actual vacancy rate?
- The area grade is low — what's the realistic commute time and amenity access for the typical tenant pool here? Any planned neighborhood developments (good or bad) we should know about?
- What's the average days-on-market for RENTAL listings here right now (not sales)? A rising rental-DOM trend means longer vacancies and softer asking-rent achievability than the comps imply.
- What's the recent tenant-quality profile in this submarket — average credit score on applications, eviction rate, late-payment / NSF rate, and stable-employment percentage? A property-management company in the area should have these aggregated.
- How much new for-sale + rental construction is in the pipeline within 1–3 miles? Heavy new supply typically softens prices + rents 12–24 months out; constrained supply supports both.
CashFlowRE · CFR-TZWSFP7JGBXFWM
· Data 1 day ago
cashflowre.app · 2026-05-29